
 TixFin
Shop analytics
Visitors, sessions, goals, funnels, Web Vitals and the checkout funnel of your shop
TixFin measures your shop itself. Nothing is sent to an outside analytics product, and a visitor is only counted after they allow Statistics in the shop's cookie banner. A visitor is an anonymous identifier that changes every calendar month; it never names a person or an account.
Where: Analytics in the sidebar. The tabs are Overview, Sessions, Events, Goals, Funnels, Behaviour, Performance and Reports. Who can do this: View analytics to read every tab. Creating, changing and deleting goals and funnels needs Manage analytics. Project owners and admins hold both.
Analytics needs a shop address. Until your project has one, each tab shows No shop address yet with a link to Choose subdomain.
Every tab except Behaviour → Returning visitors follows the date range at the top right. It starts at the last 30 days.
Overview
Visitors, sessions, page views, bounce rate, session duration and live visitors, with charts by page, referrer, browser and country. Below them:
- Campaign attribution — visits, checkouts and purchases per channel and campaign.
- Checkout funnel — how many shop sessions viewed tickets, added to the cart, entered their details, started payment and purchased, with the drop-off between steps. It covers up to the last 90 days. Narrow it to one event, one ticket type, a channel or a campaign with the filters above it; a filter counts every session that touched it, at each step that session reached. Channel and campaign are known only for visitors who also allowed Marketing, and steps recorded before 24 October 2026 appear only without a filter. By campaign below the steps lists each campaign's sessions, purchases and conversion, plus the sessions that named no campaign (including every step recorded before 24 October 2026); click a campaign to filter the funnel by it.
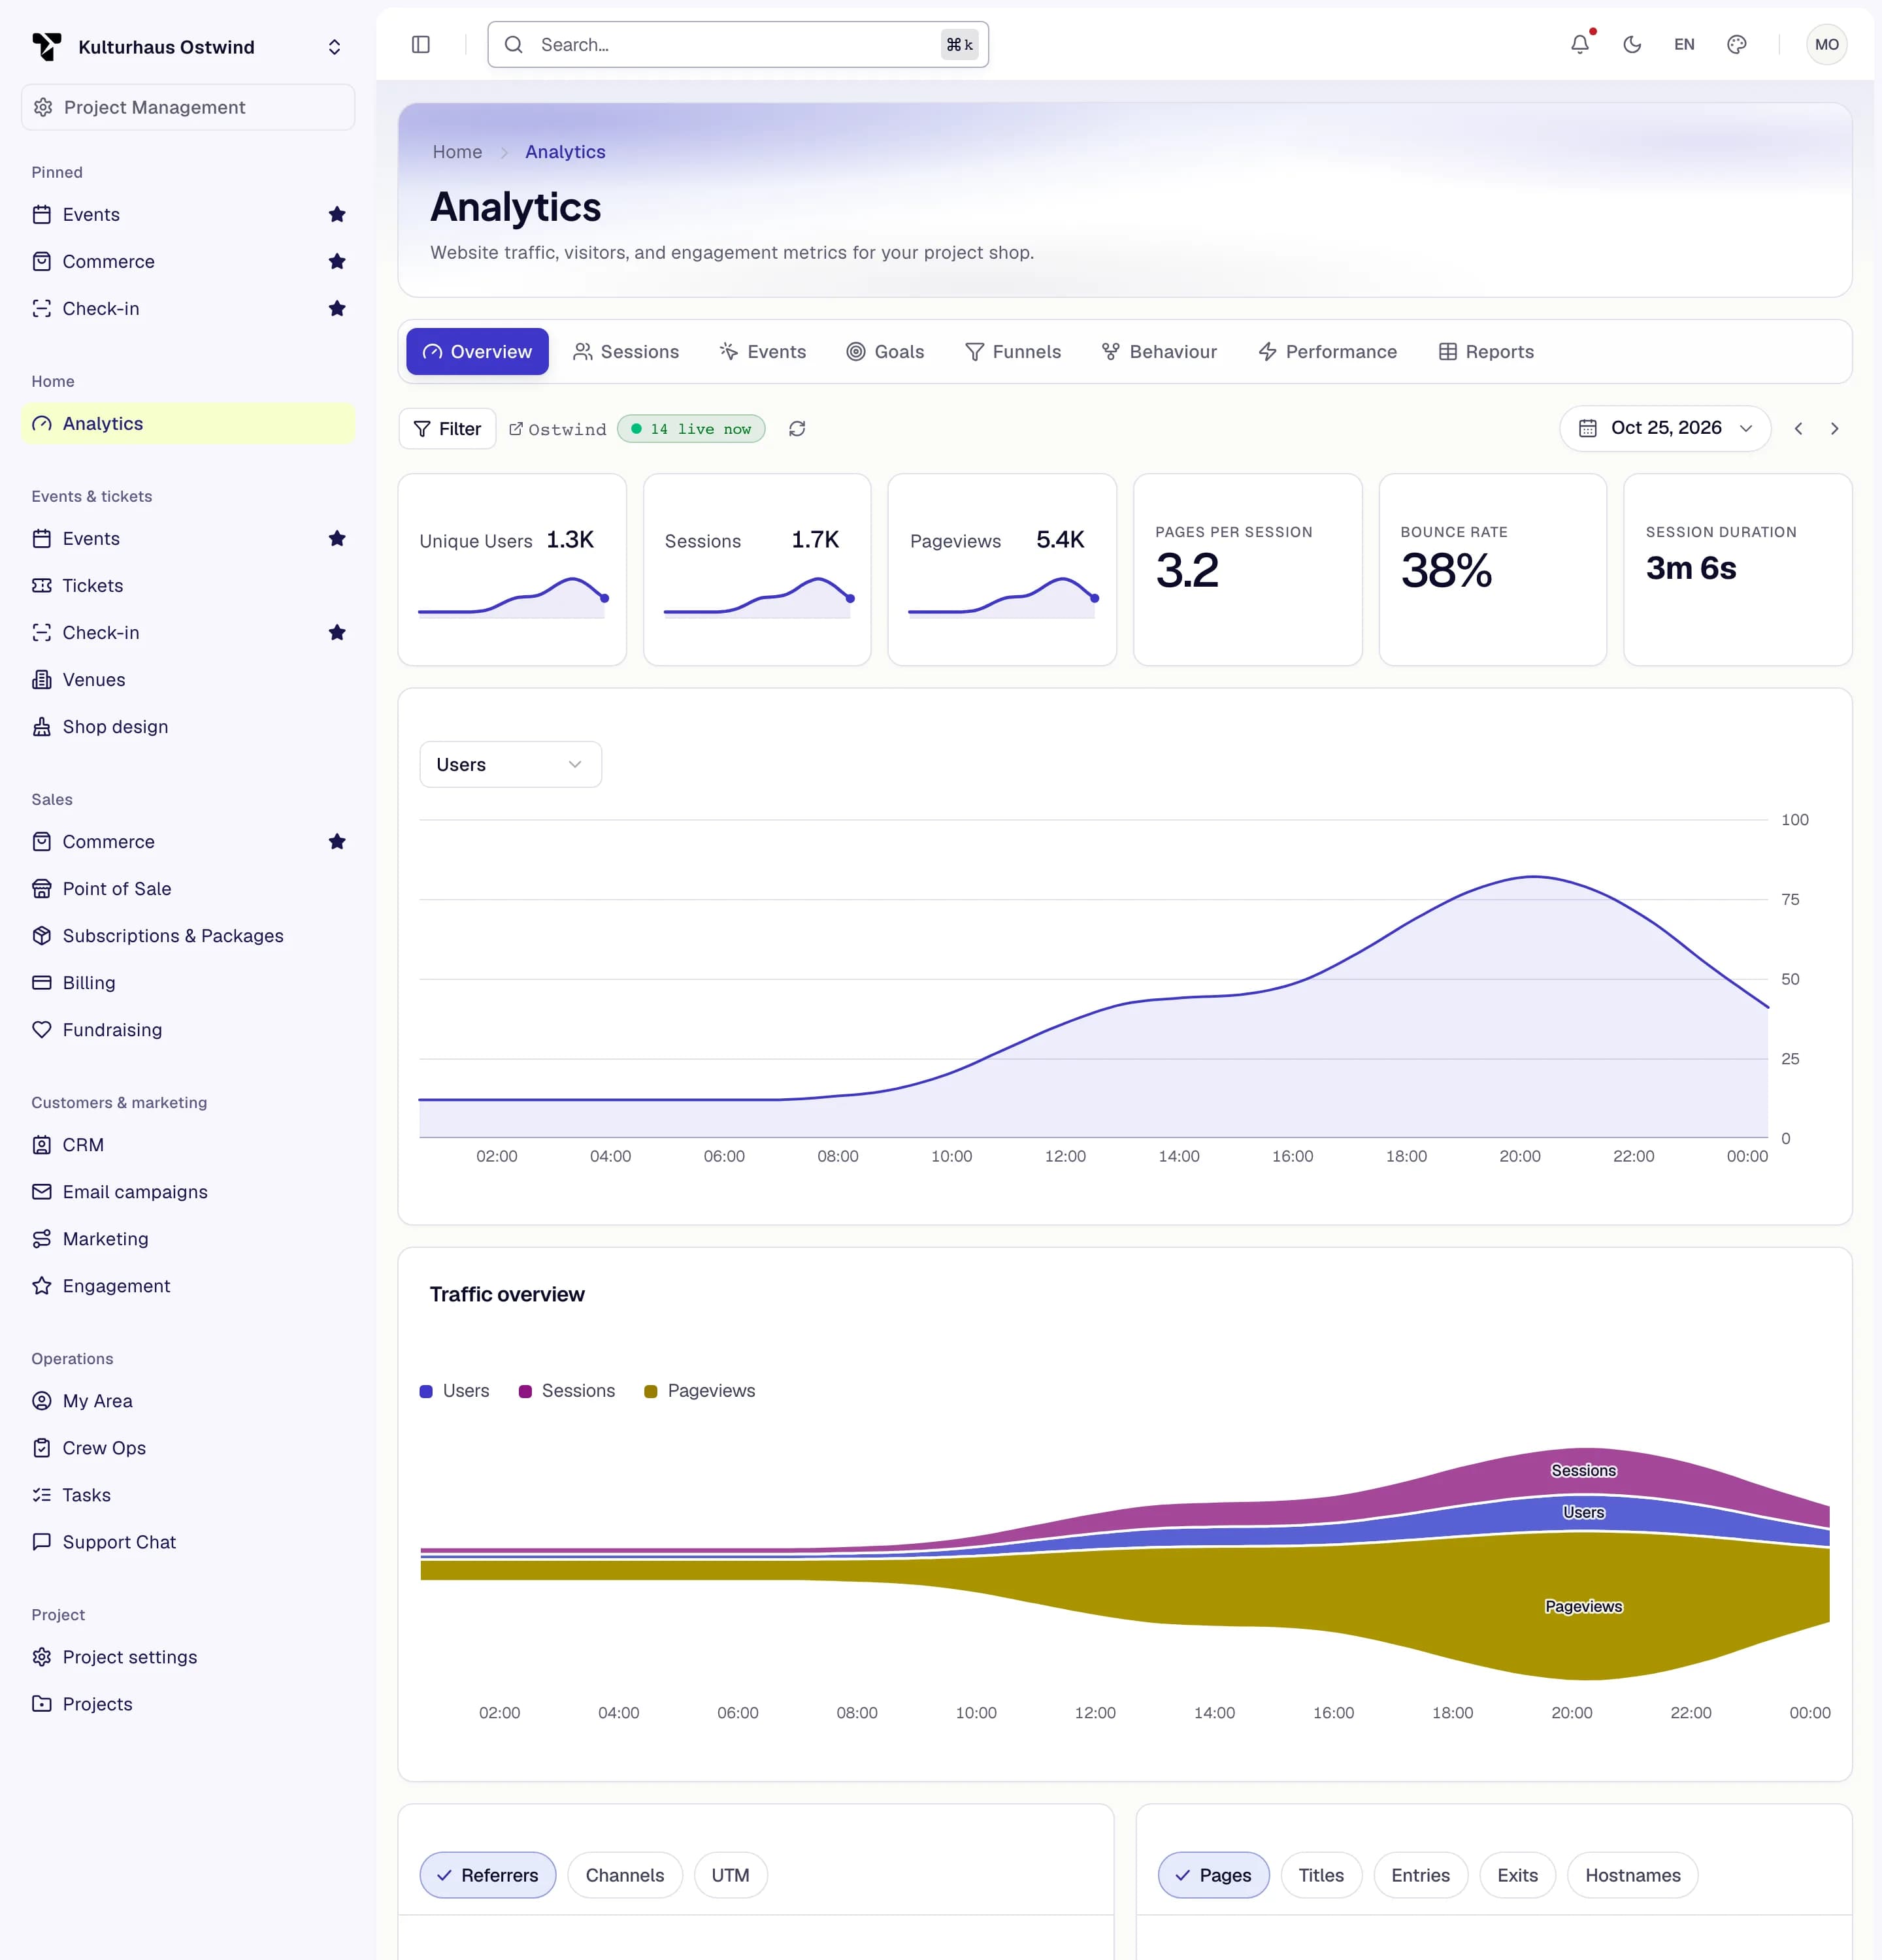
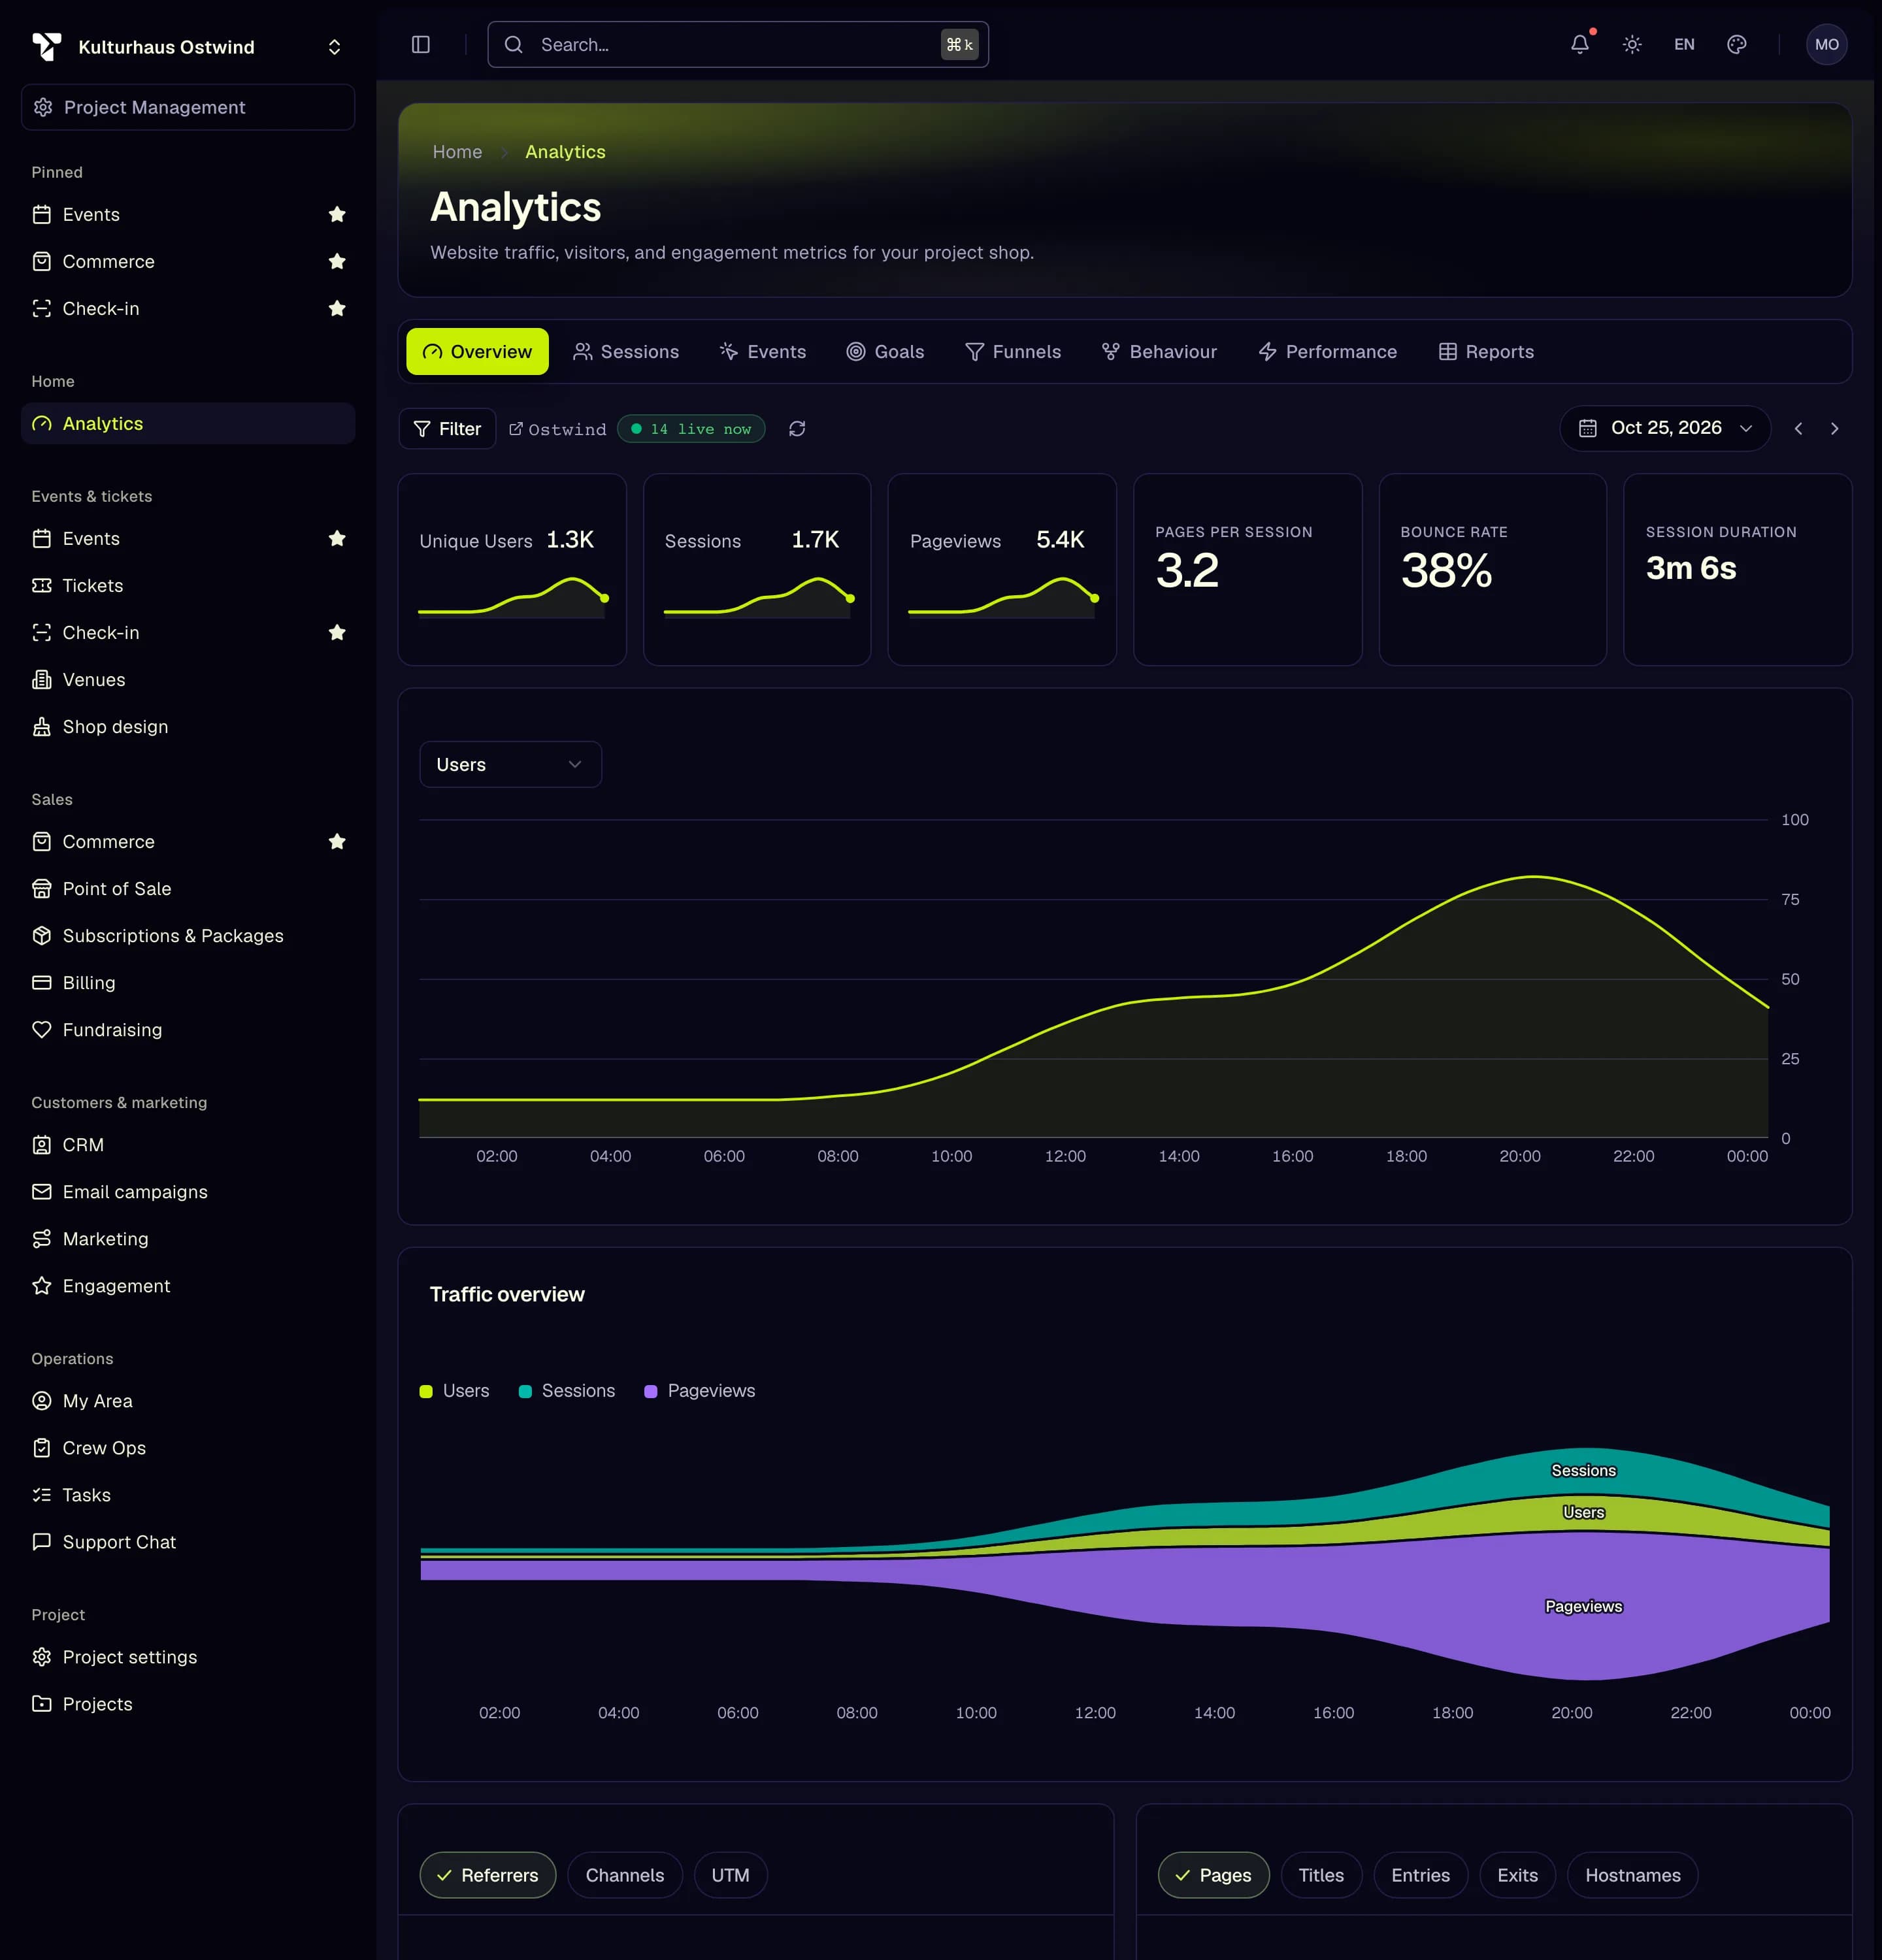
- Overview tab
- Date range
- Visitors, sessions, page views
- Live visitors
- By referrer, channel, page
Sessions and visitors
Sessions lists every visit, newest first, with its entry page, channel, device, page views and duration. Click a session to see every page view and event in it, in order.
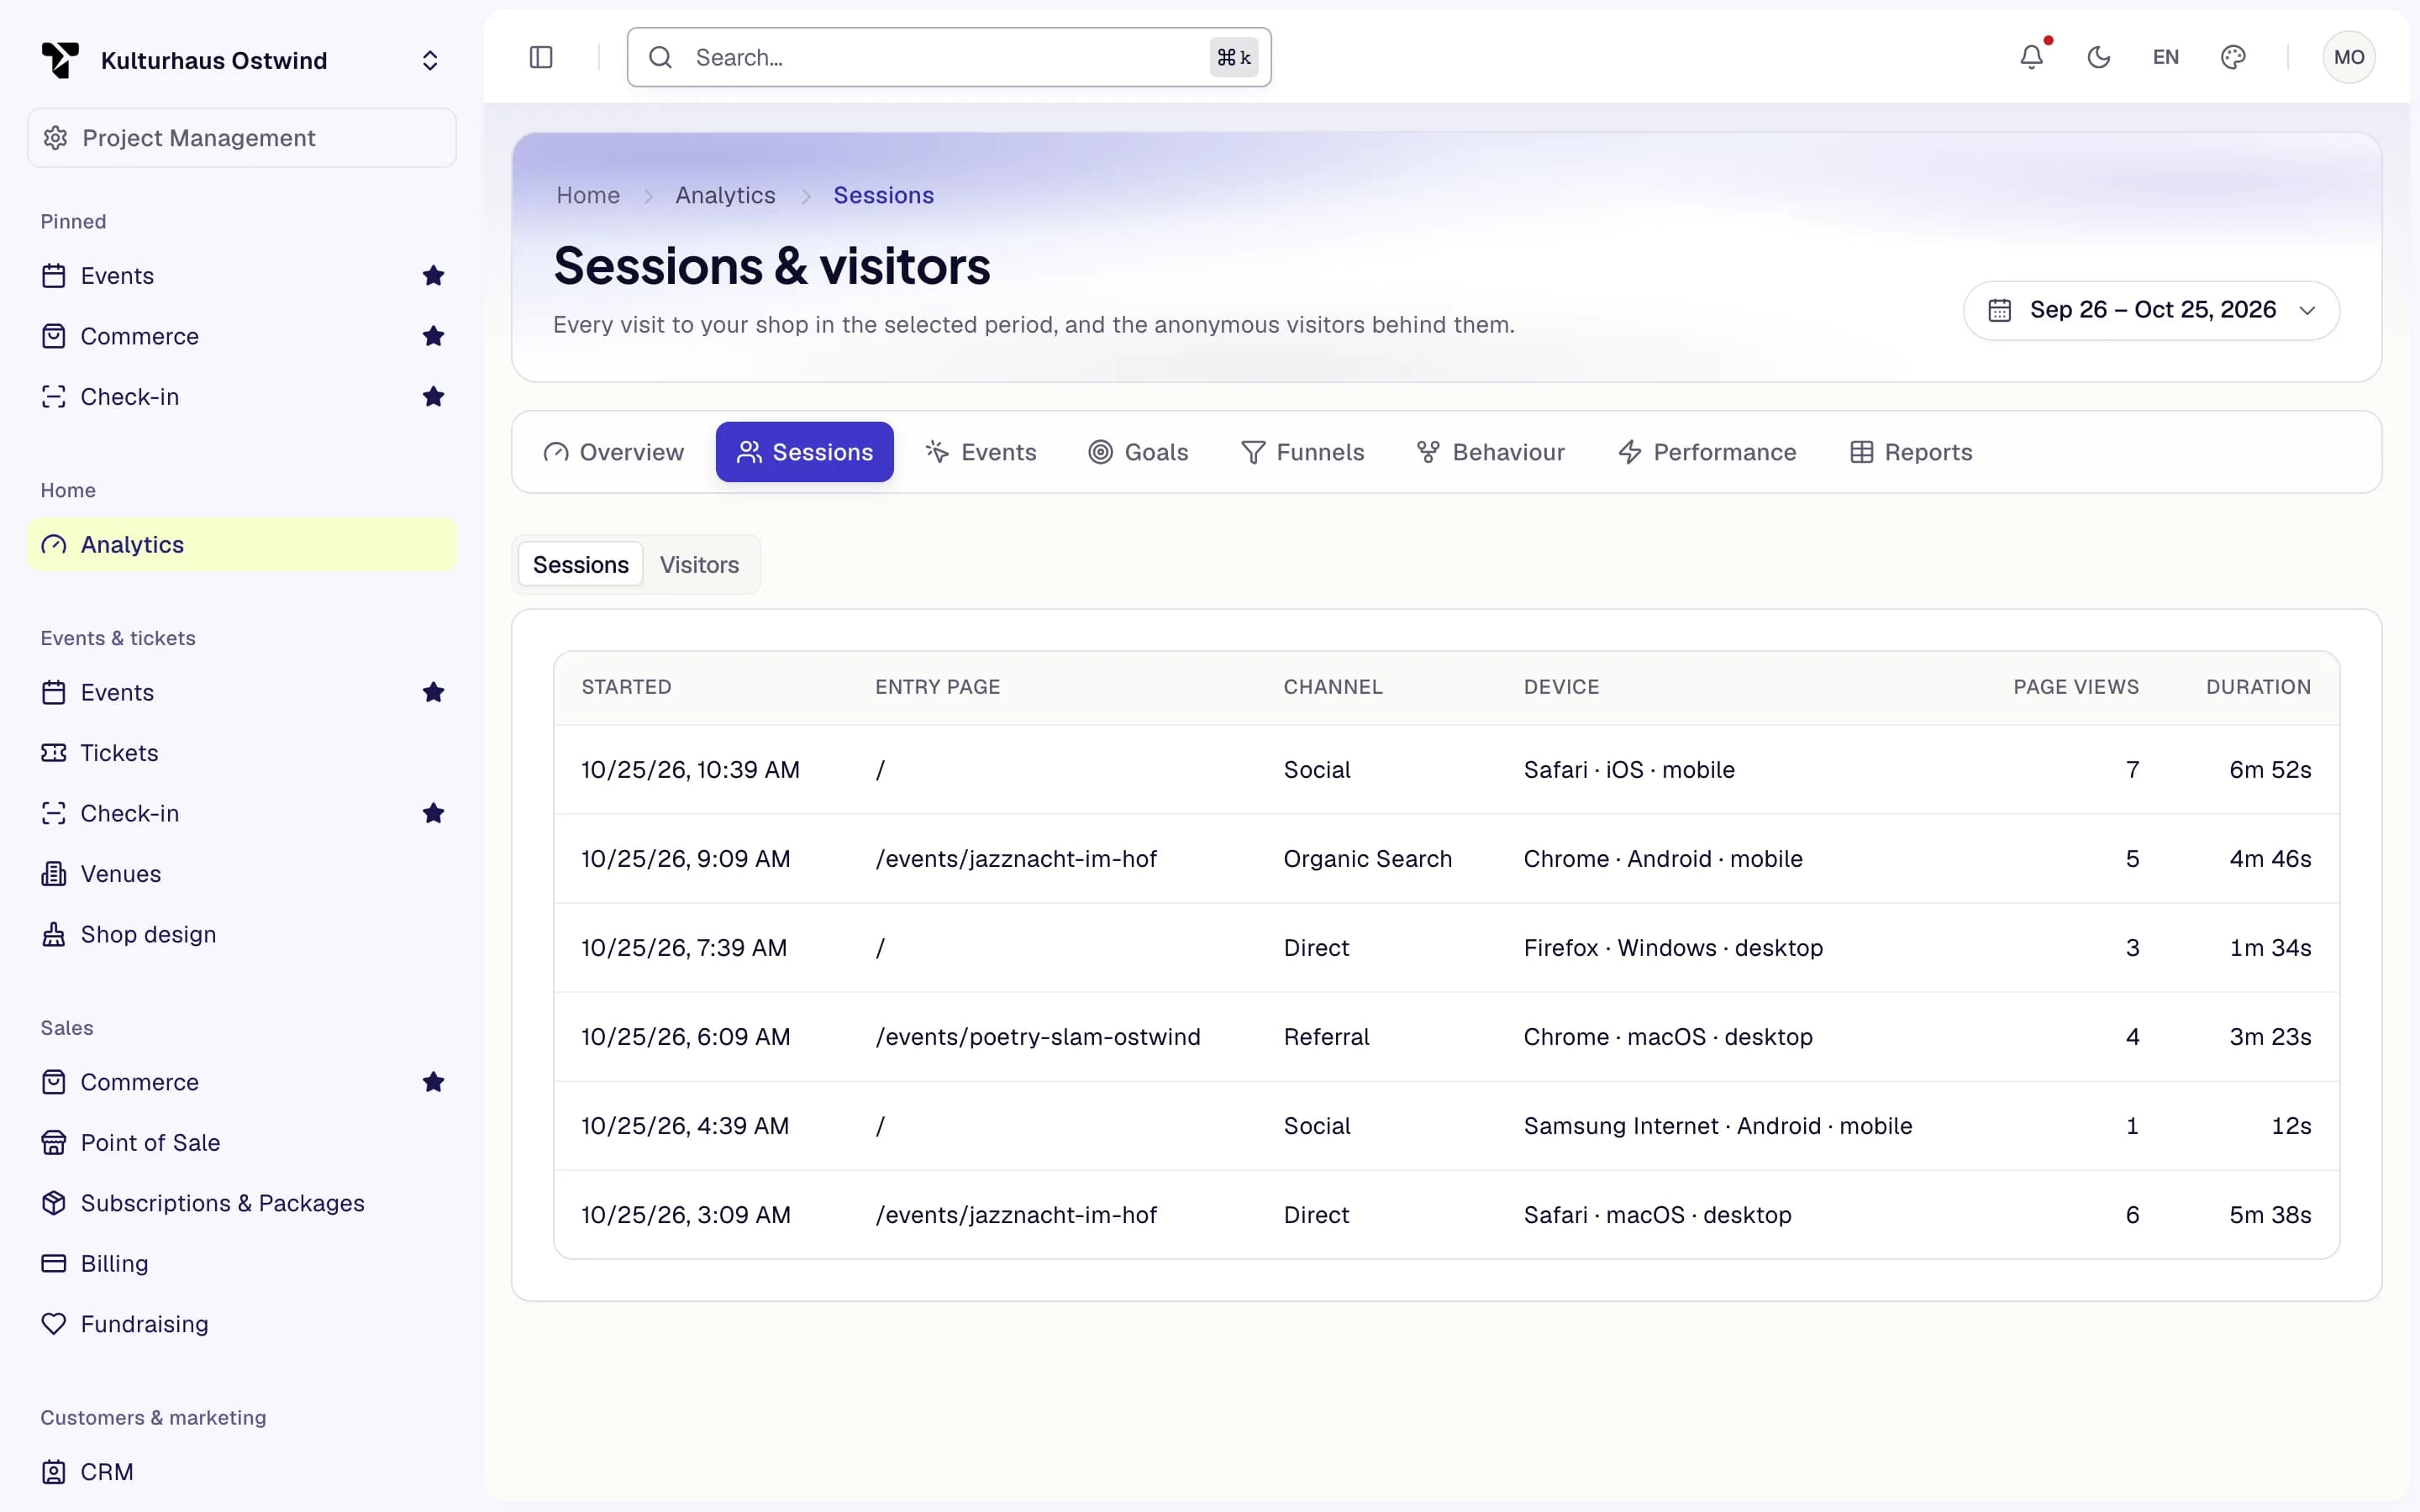
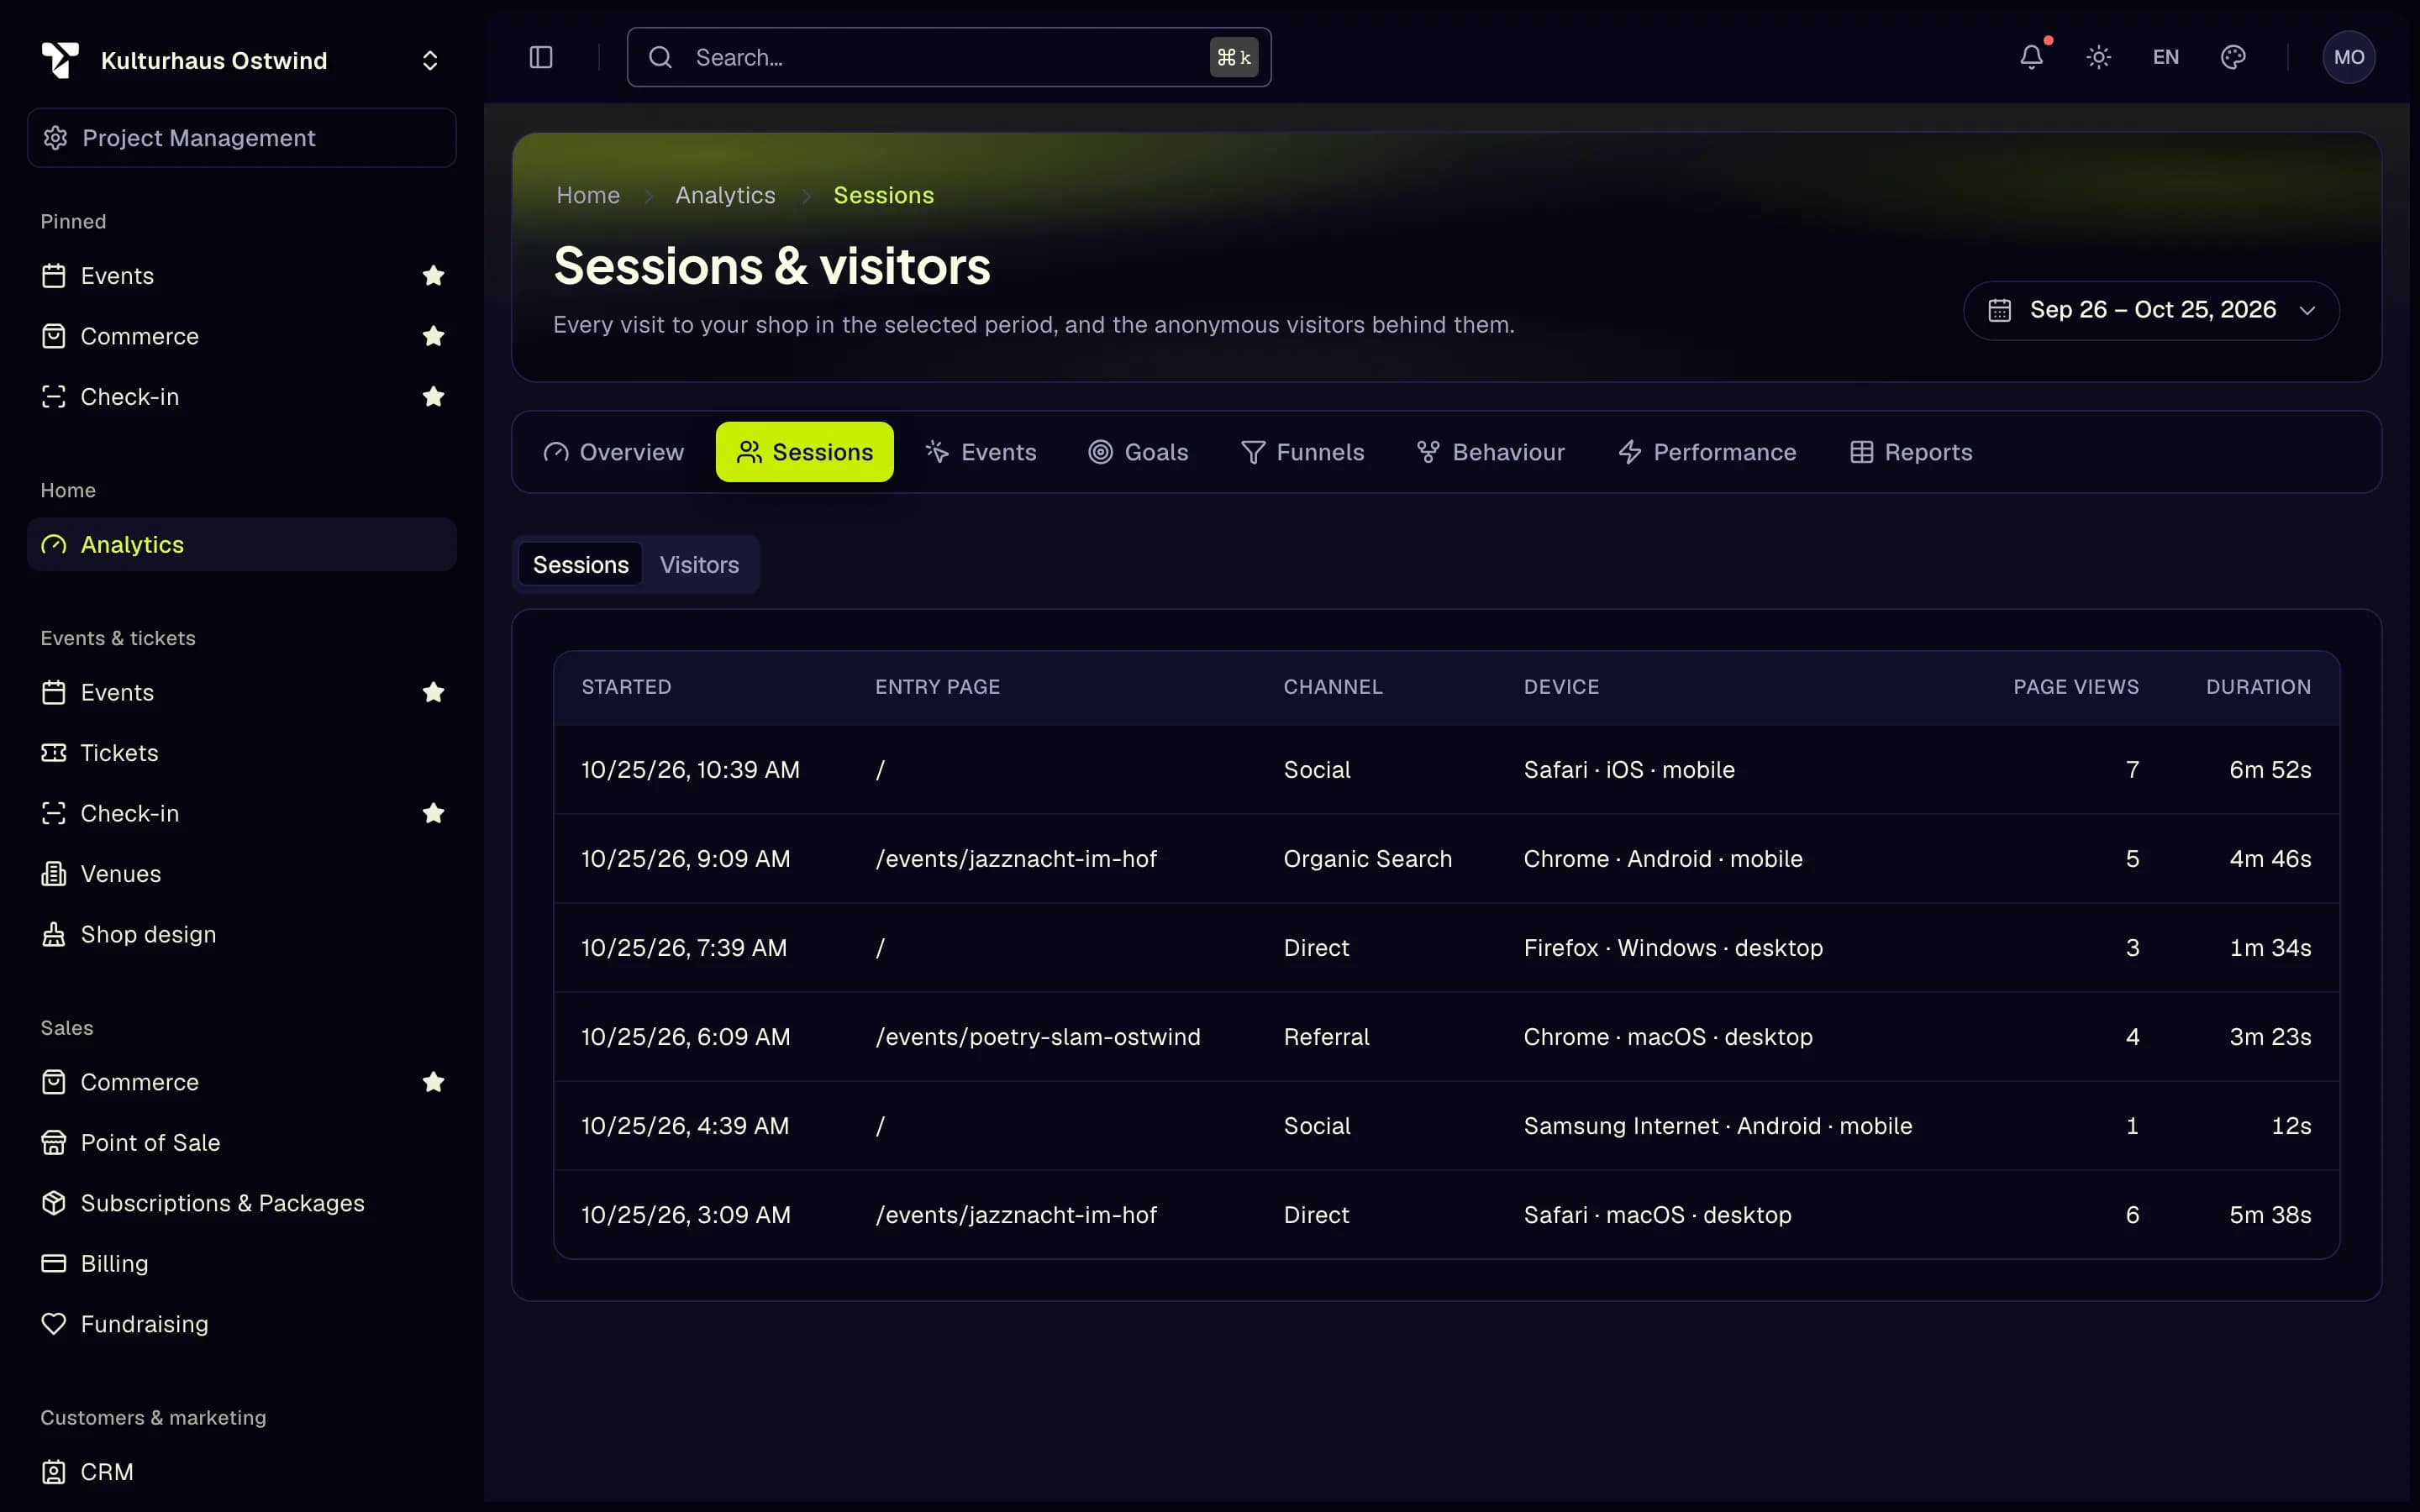
- Sessions tab
- Date range
- Click a session
- Visitors
Visitors lists the anonymous visitors of the period with their sessions and page views. Click one to see their sessions per day and each session.
Events
- Custom events — how often each event your shop sends fired.
- Outbound links — links that took visitors away from your shop, with clicks and the last click.
- Event stream — every event of the period, newest first.
Goals
A goal counts every session that reached a page or fired a custom event.
/. Use * as a wildcard, for example /checkout/success*. For an event, enter the Event name.The list shows each goal's conversions and conversion rate for the period. Click a goal to see the sessions that reached it. Use the pencil to change a goal and the bin to delete it (press and hold to confirm).
Funnels
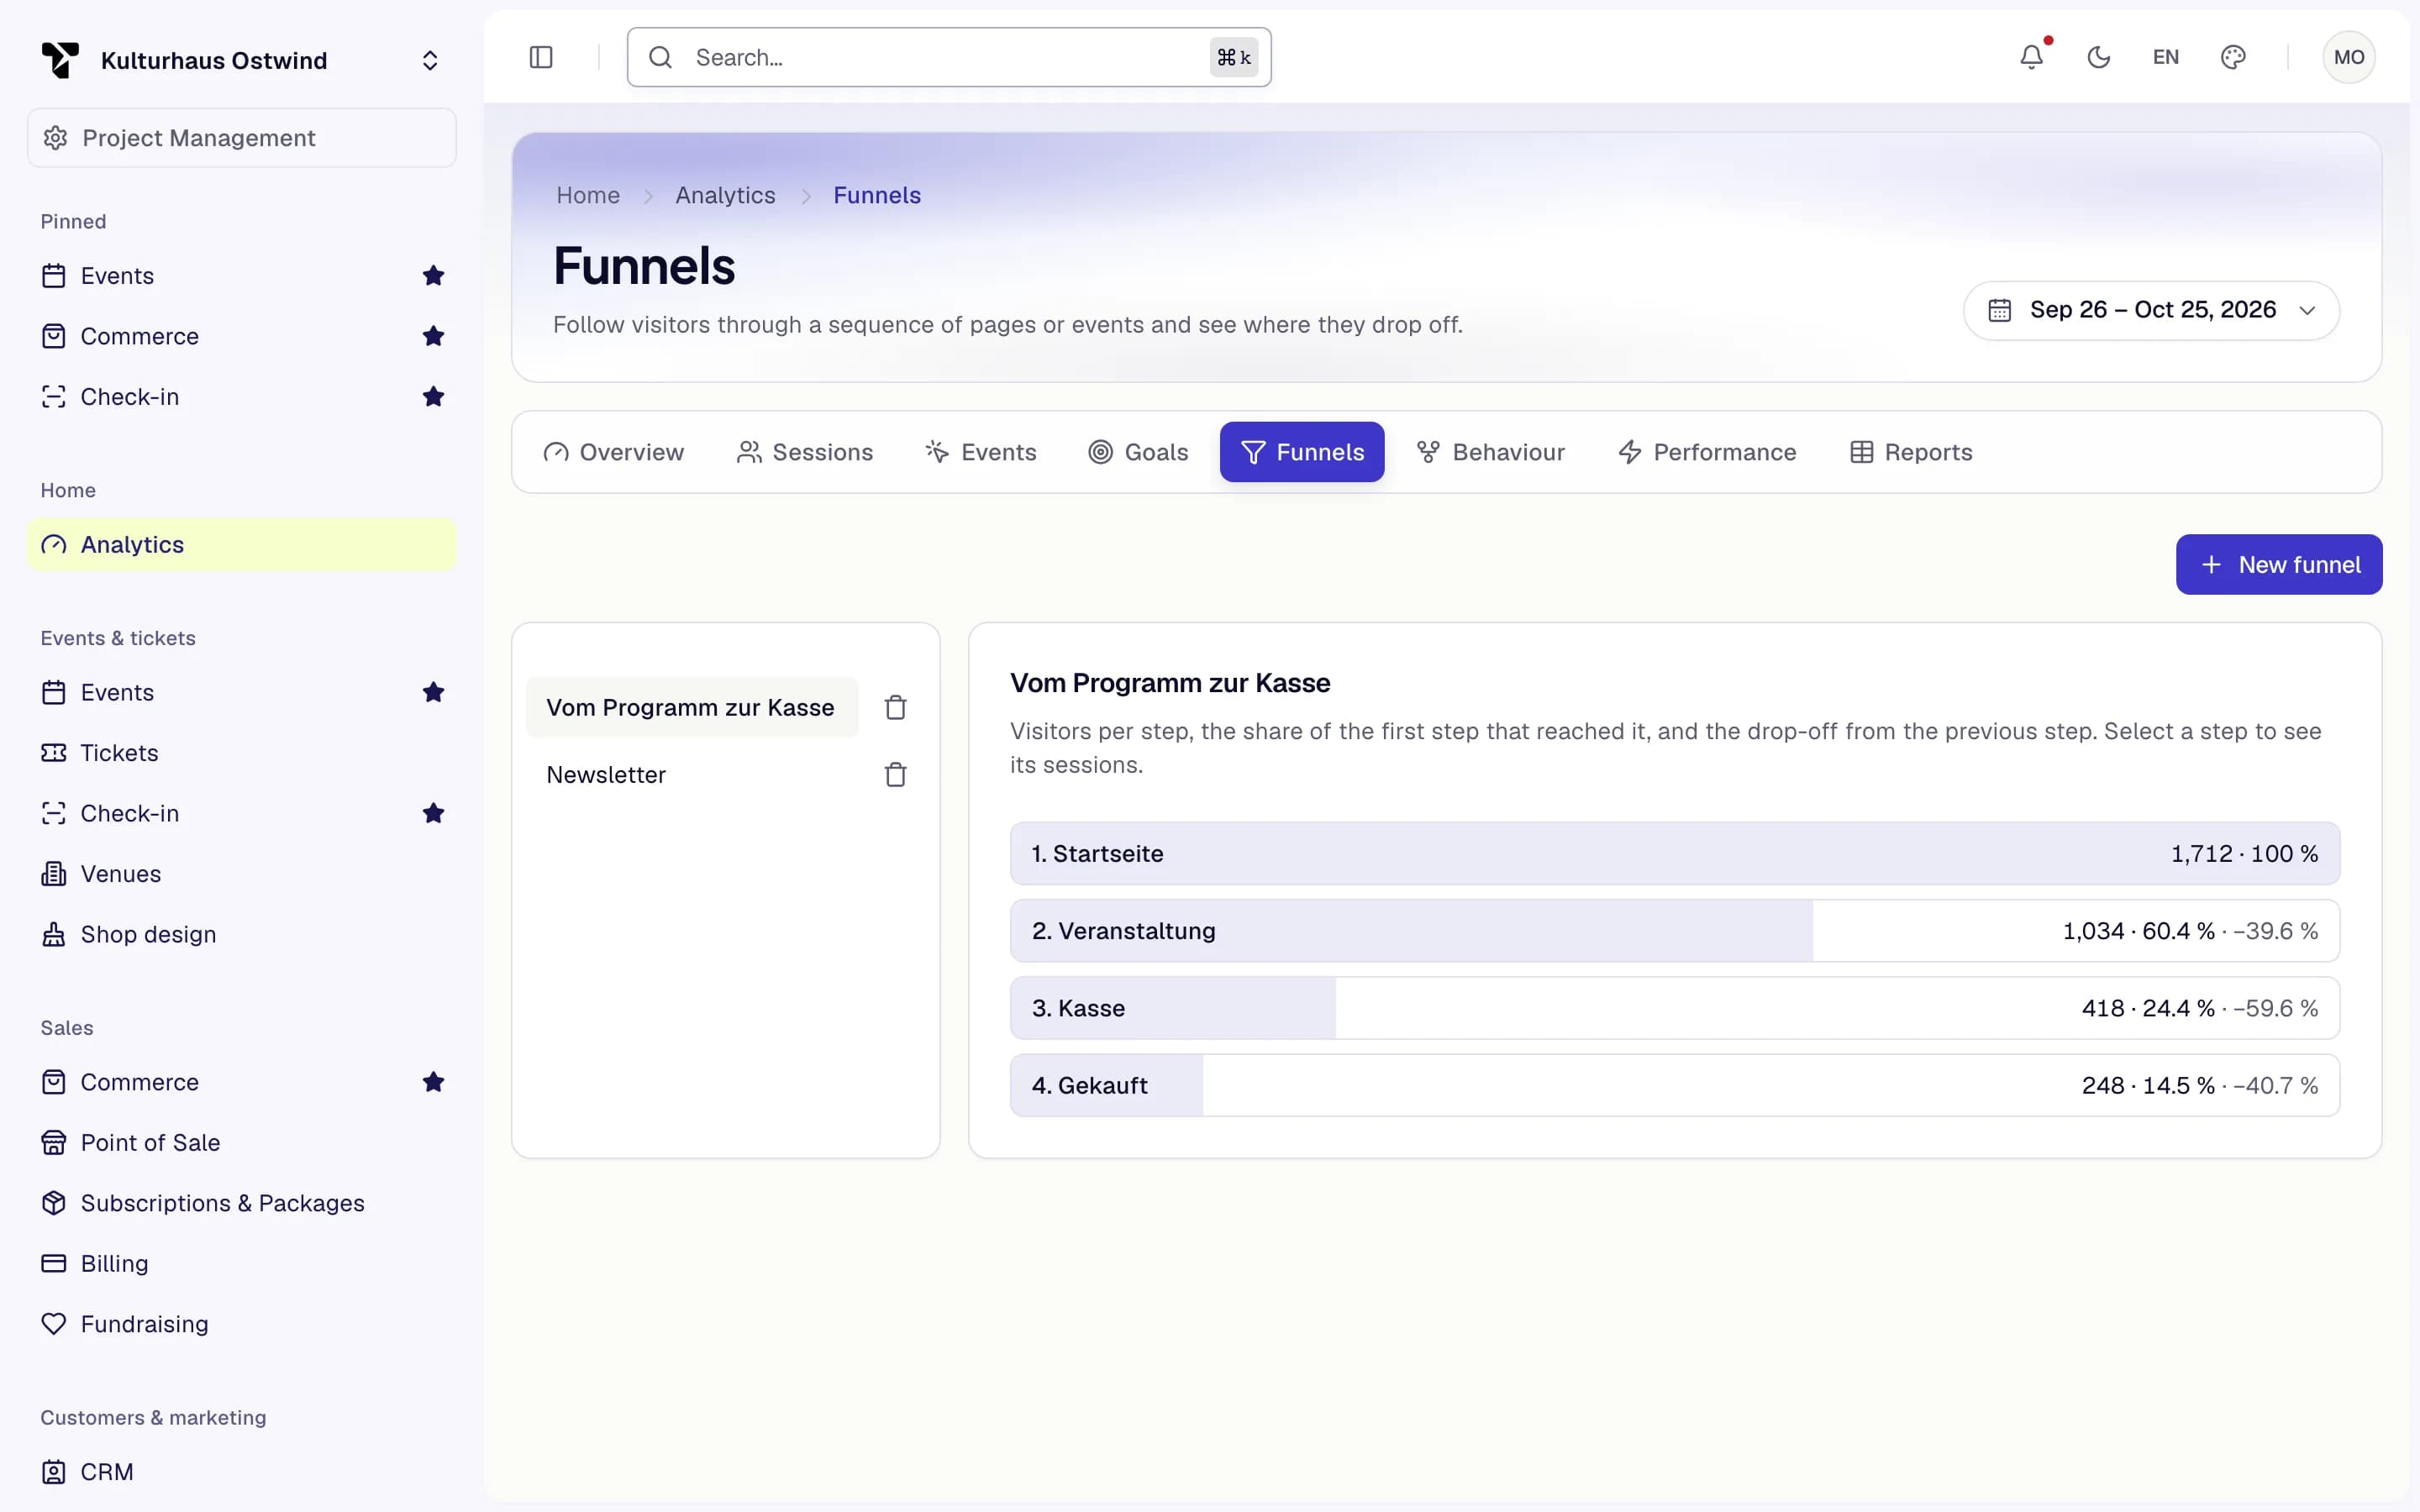
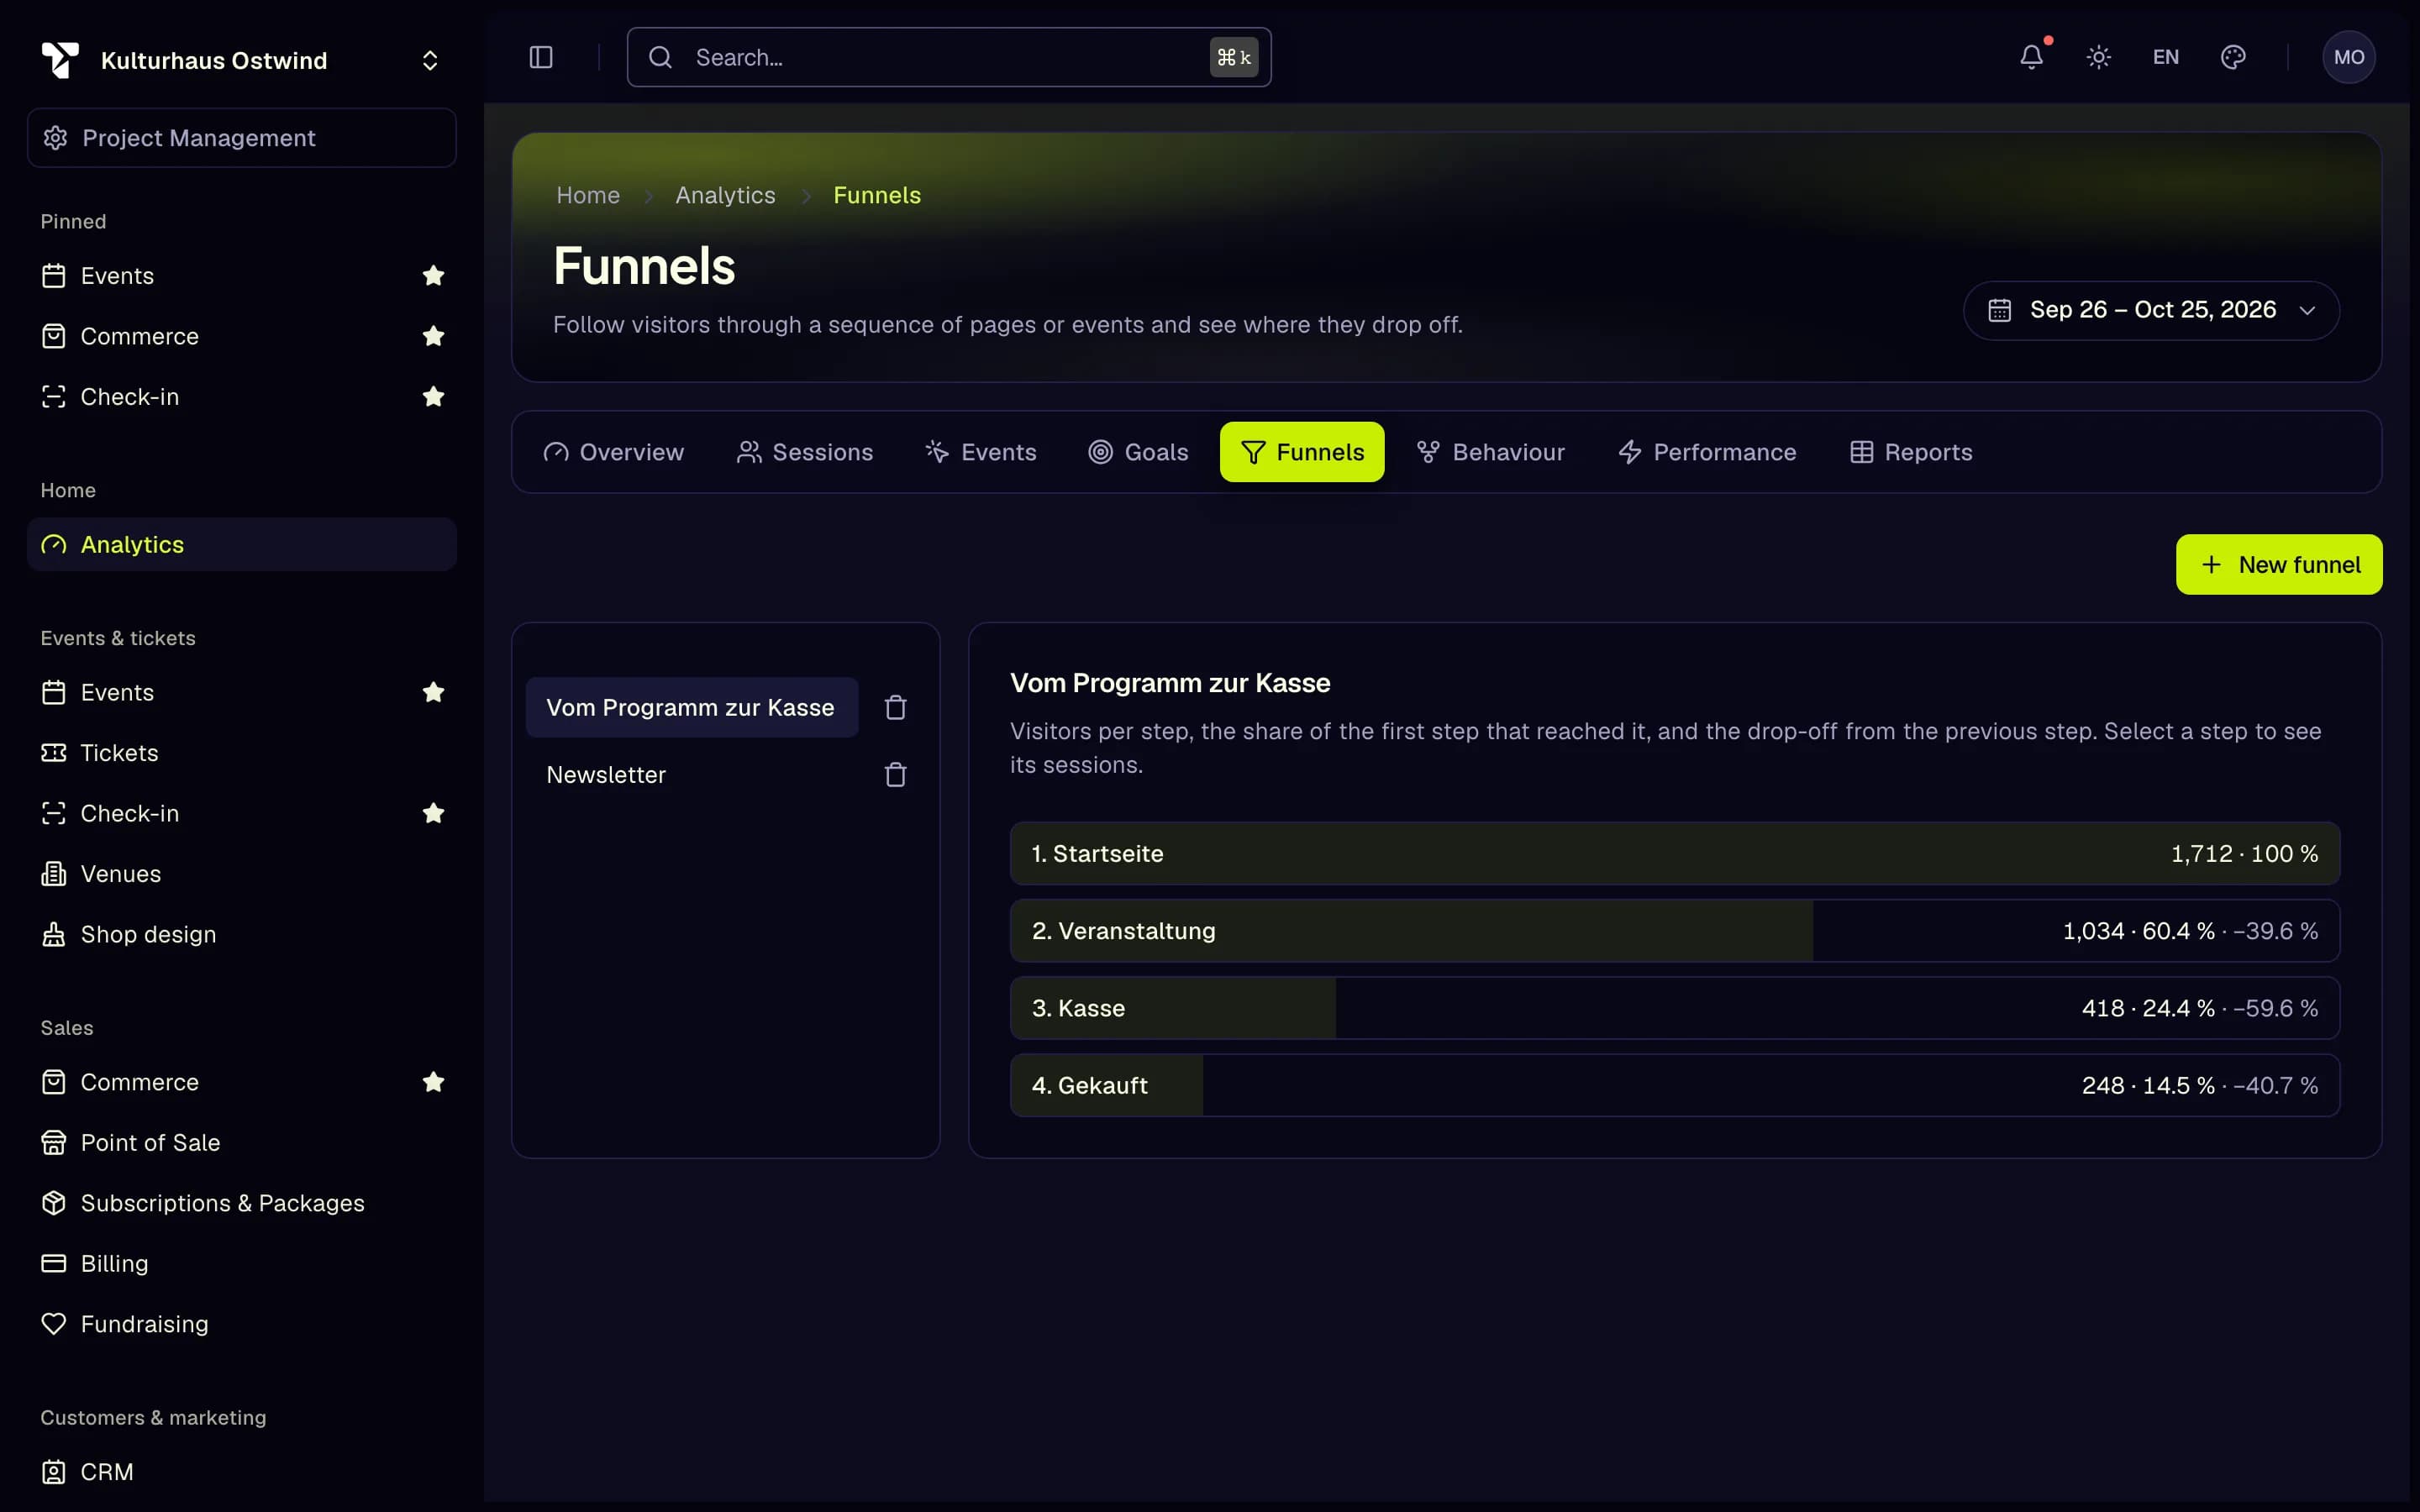
A funnel follows visitors through two to ten steps in order and shows where they drop off.
/, * as a wildcard) or Event (a custom event name). Use Add step and the × to change the number of steps.Pick a saved funnel on the left to see, per step, the visitors who reached it, their share of the first step and the drop-off from the previous step. Click a step to list its sessions, and switch to Dropped off to see the sessions that reached the previous step but not this one.
- New funnel
- Pick a saved funnel
- Click a step for its sessions
- Visitors, share and drop-off
Behaviour
- Top journeys — the most common sequences of the first two to five pages in a session.
- Returning visitors — weekly cohorts over the last 90 days, or daily cohorts over the last 30 days, with the share that came back in each later period. A return in a later calendar month shows as —, because visitor identifiers change every month.
Performance and errors
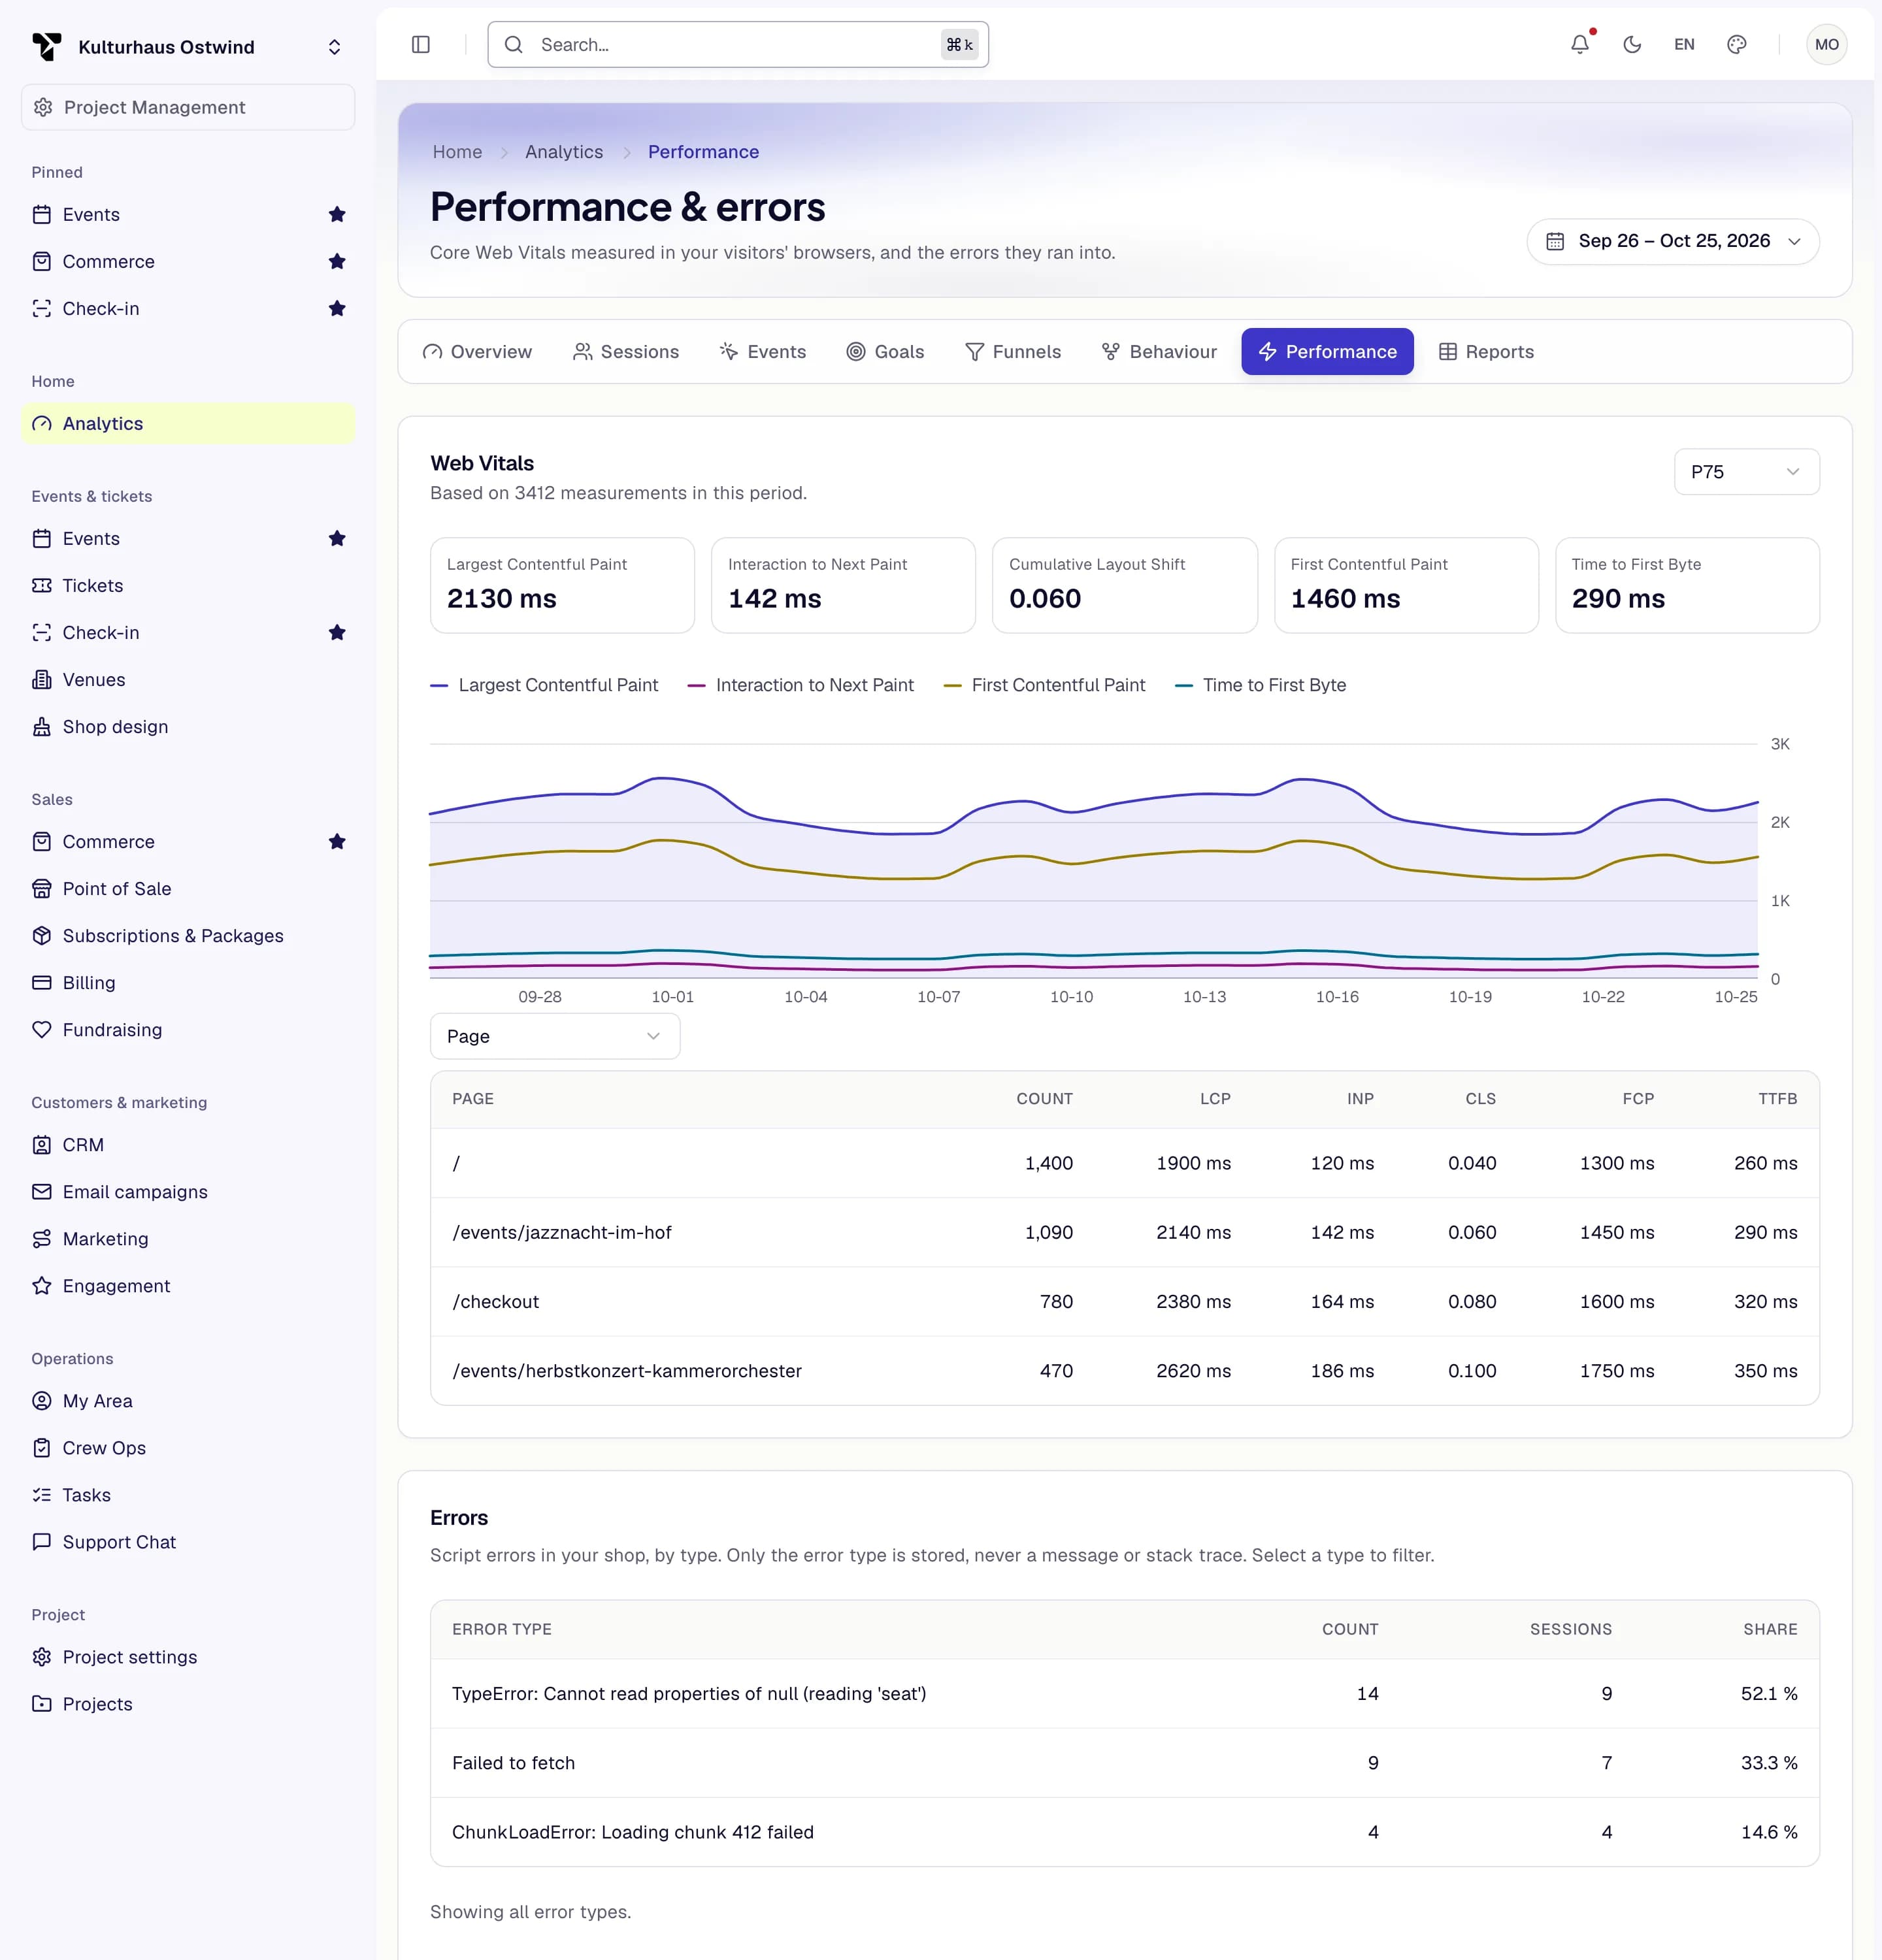
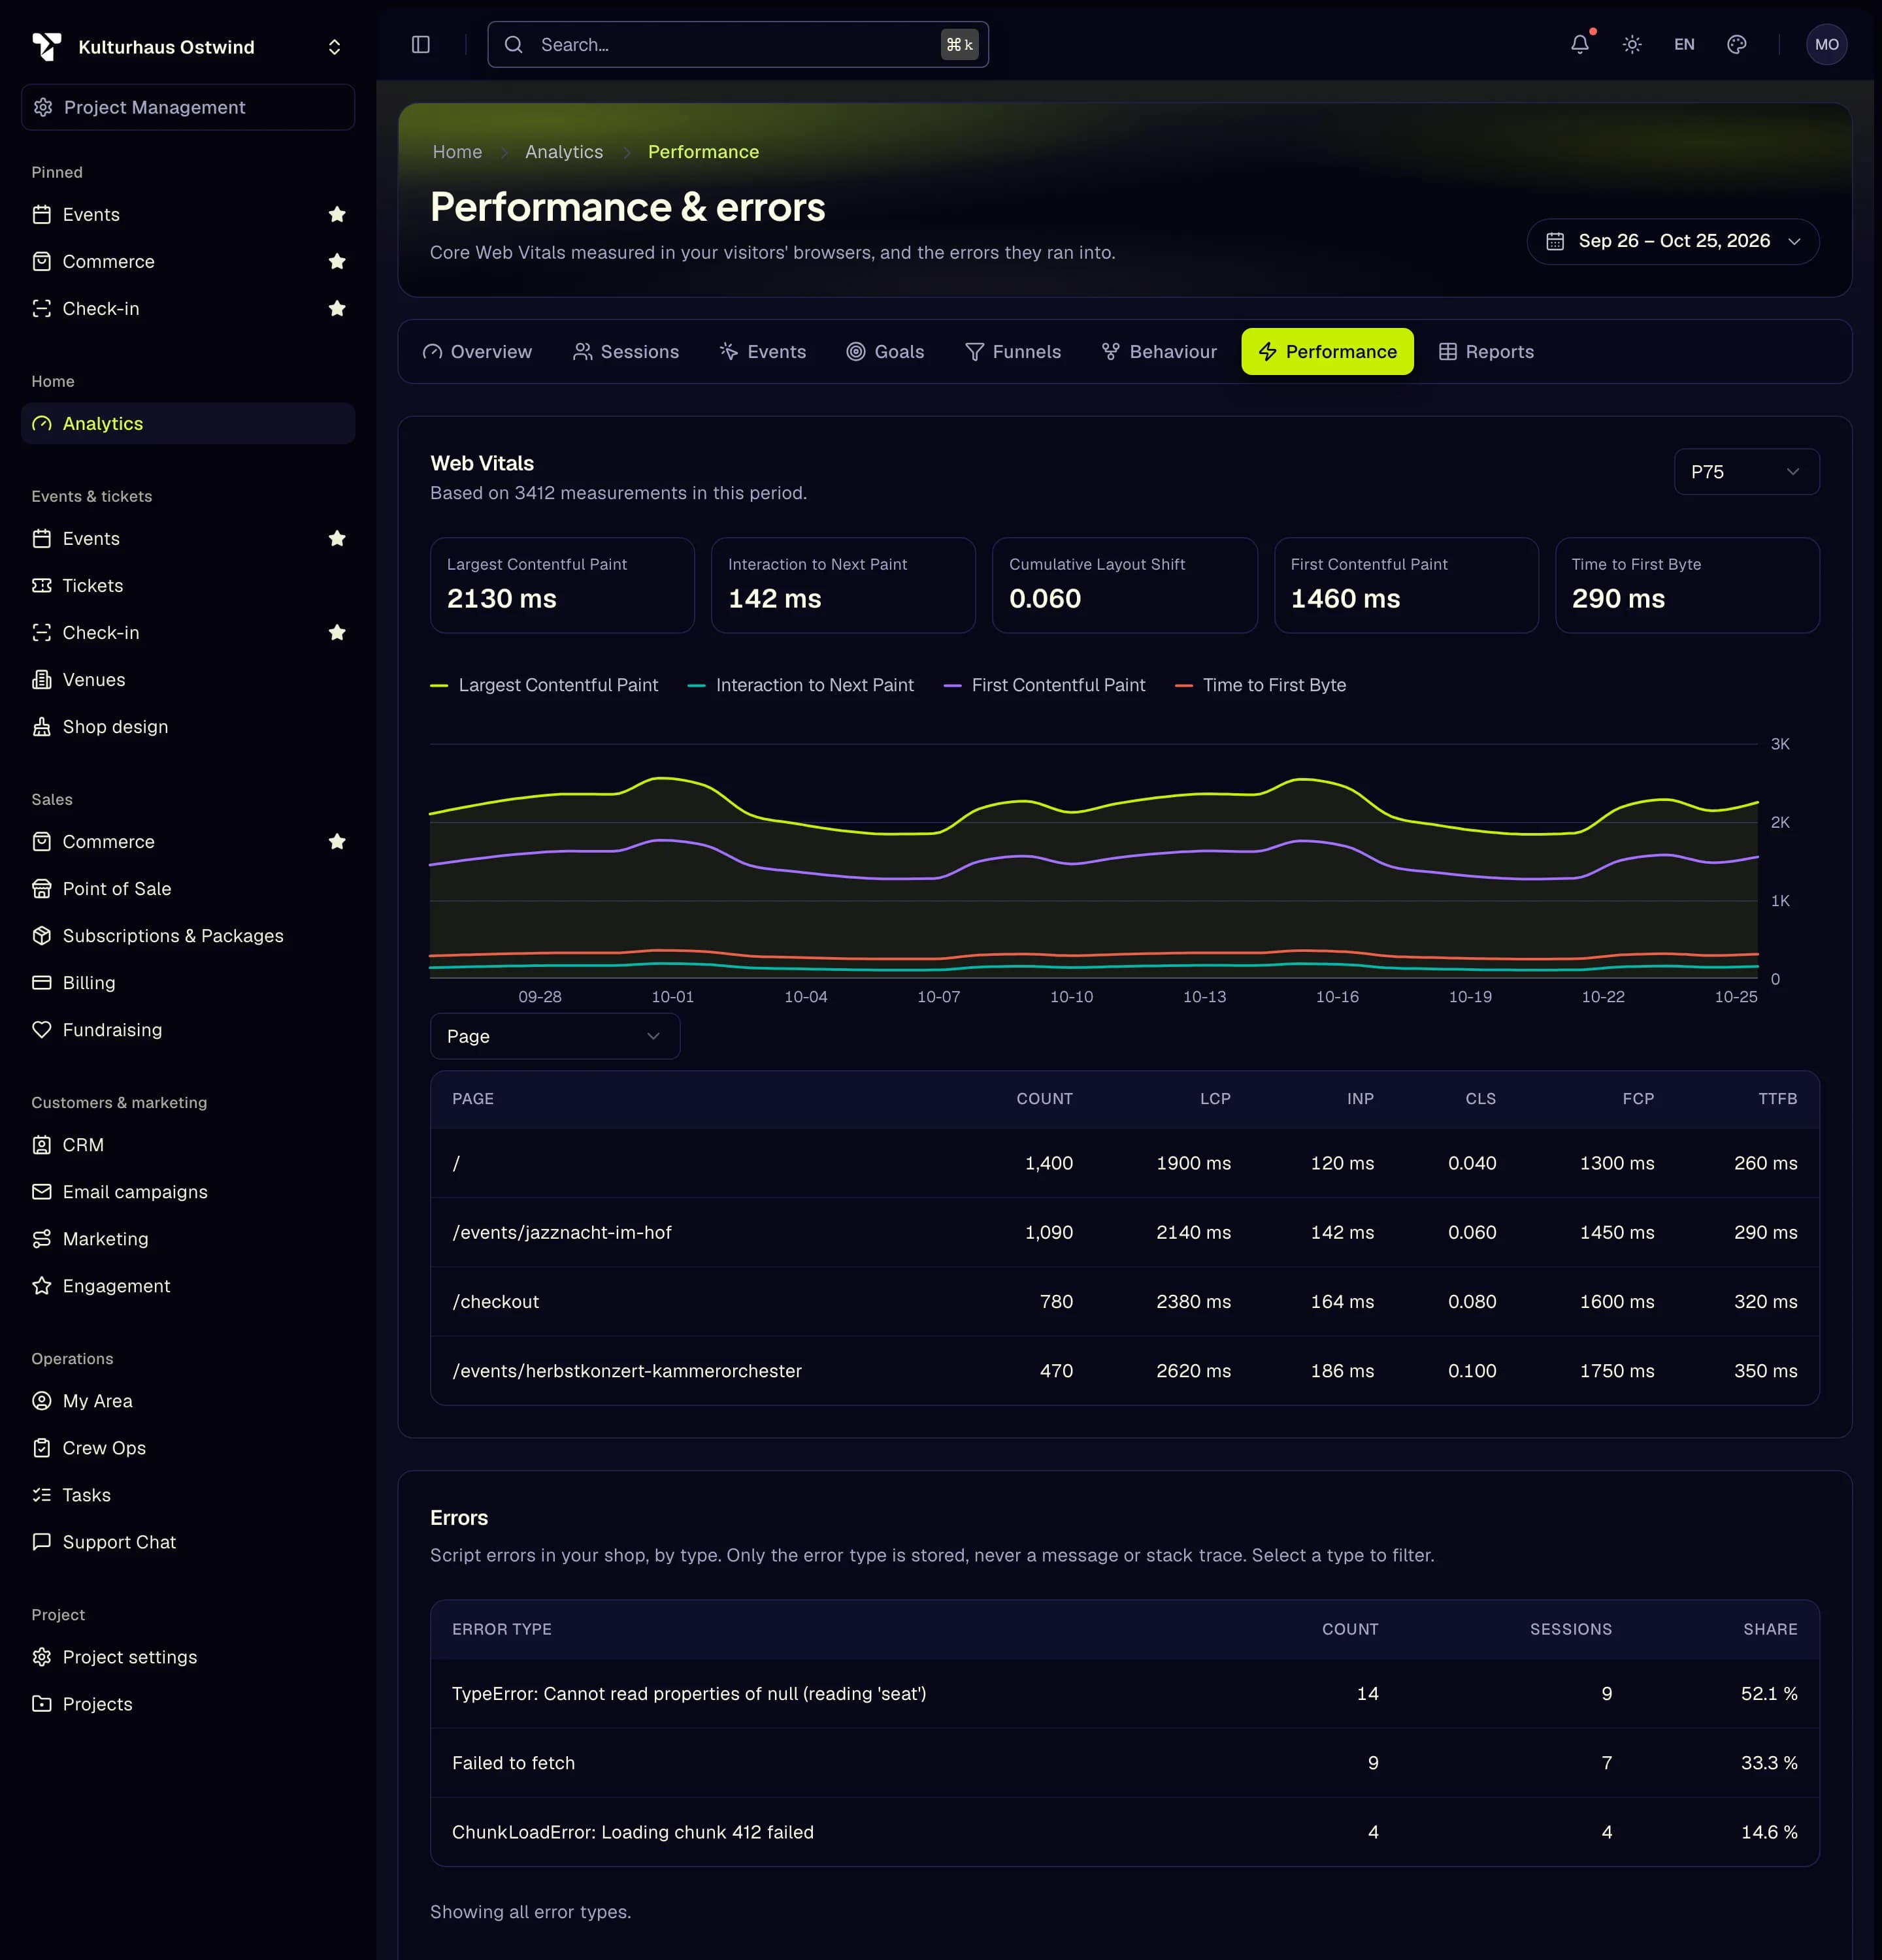
Web Vitals shows Largest Contentful Paint, Interaction to Next Paint, Cumulative Layout Shift, First Contentful Paint and Time to First Byte as measured in your visitors' browsers. Choose the percentile (P50 to P99) at the top right. The chart shows the vitals over time, and the table groups them by page, browser, operating system, device type or host.
- Performance tab
- Percentile
- Web Vitals over time
- Group by page, browser …
- Click an error type
Errors ranks script errors by type. Only the type is stored, never a message or a stack trace. Click a type to filter the chart and the list of occurrences to it; click it again to show all types.
Reports
Reports lists your custom reports over revenue, tickets and donations, with the number of metrics and dimensions of each. Click Create report, or open a report to set its Name, Metrics, Dimensions, Date range filter, Dimension filters and Sort, then click Save changes. Run preview runs the saved definition against live data, and Export downloads the report as CSV, XLSX or PDF.
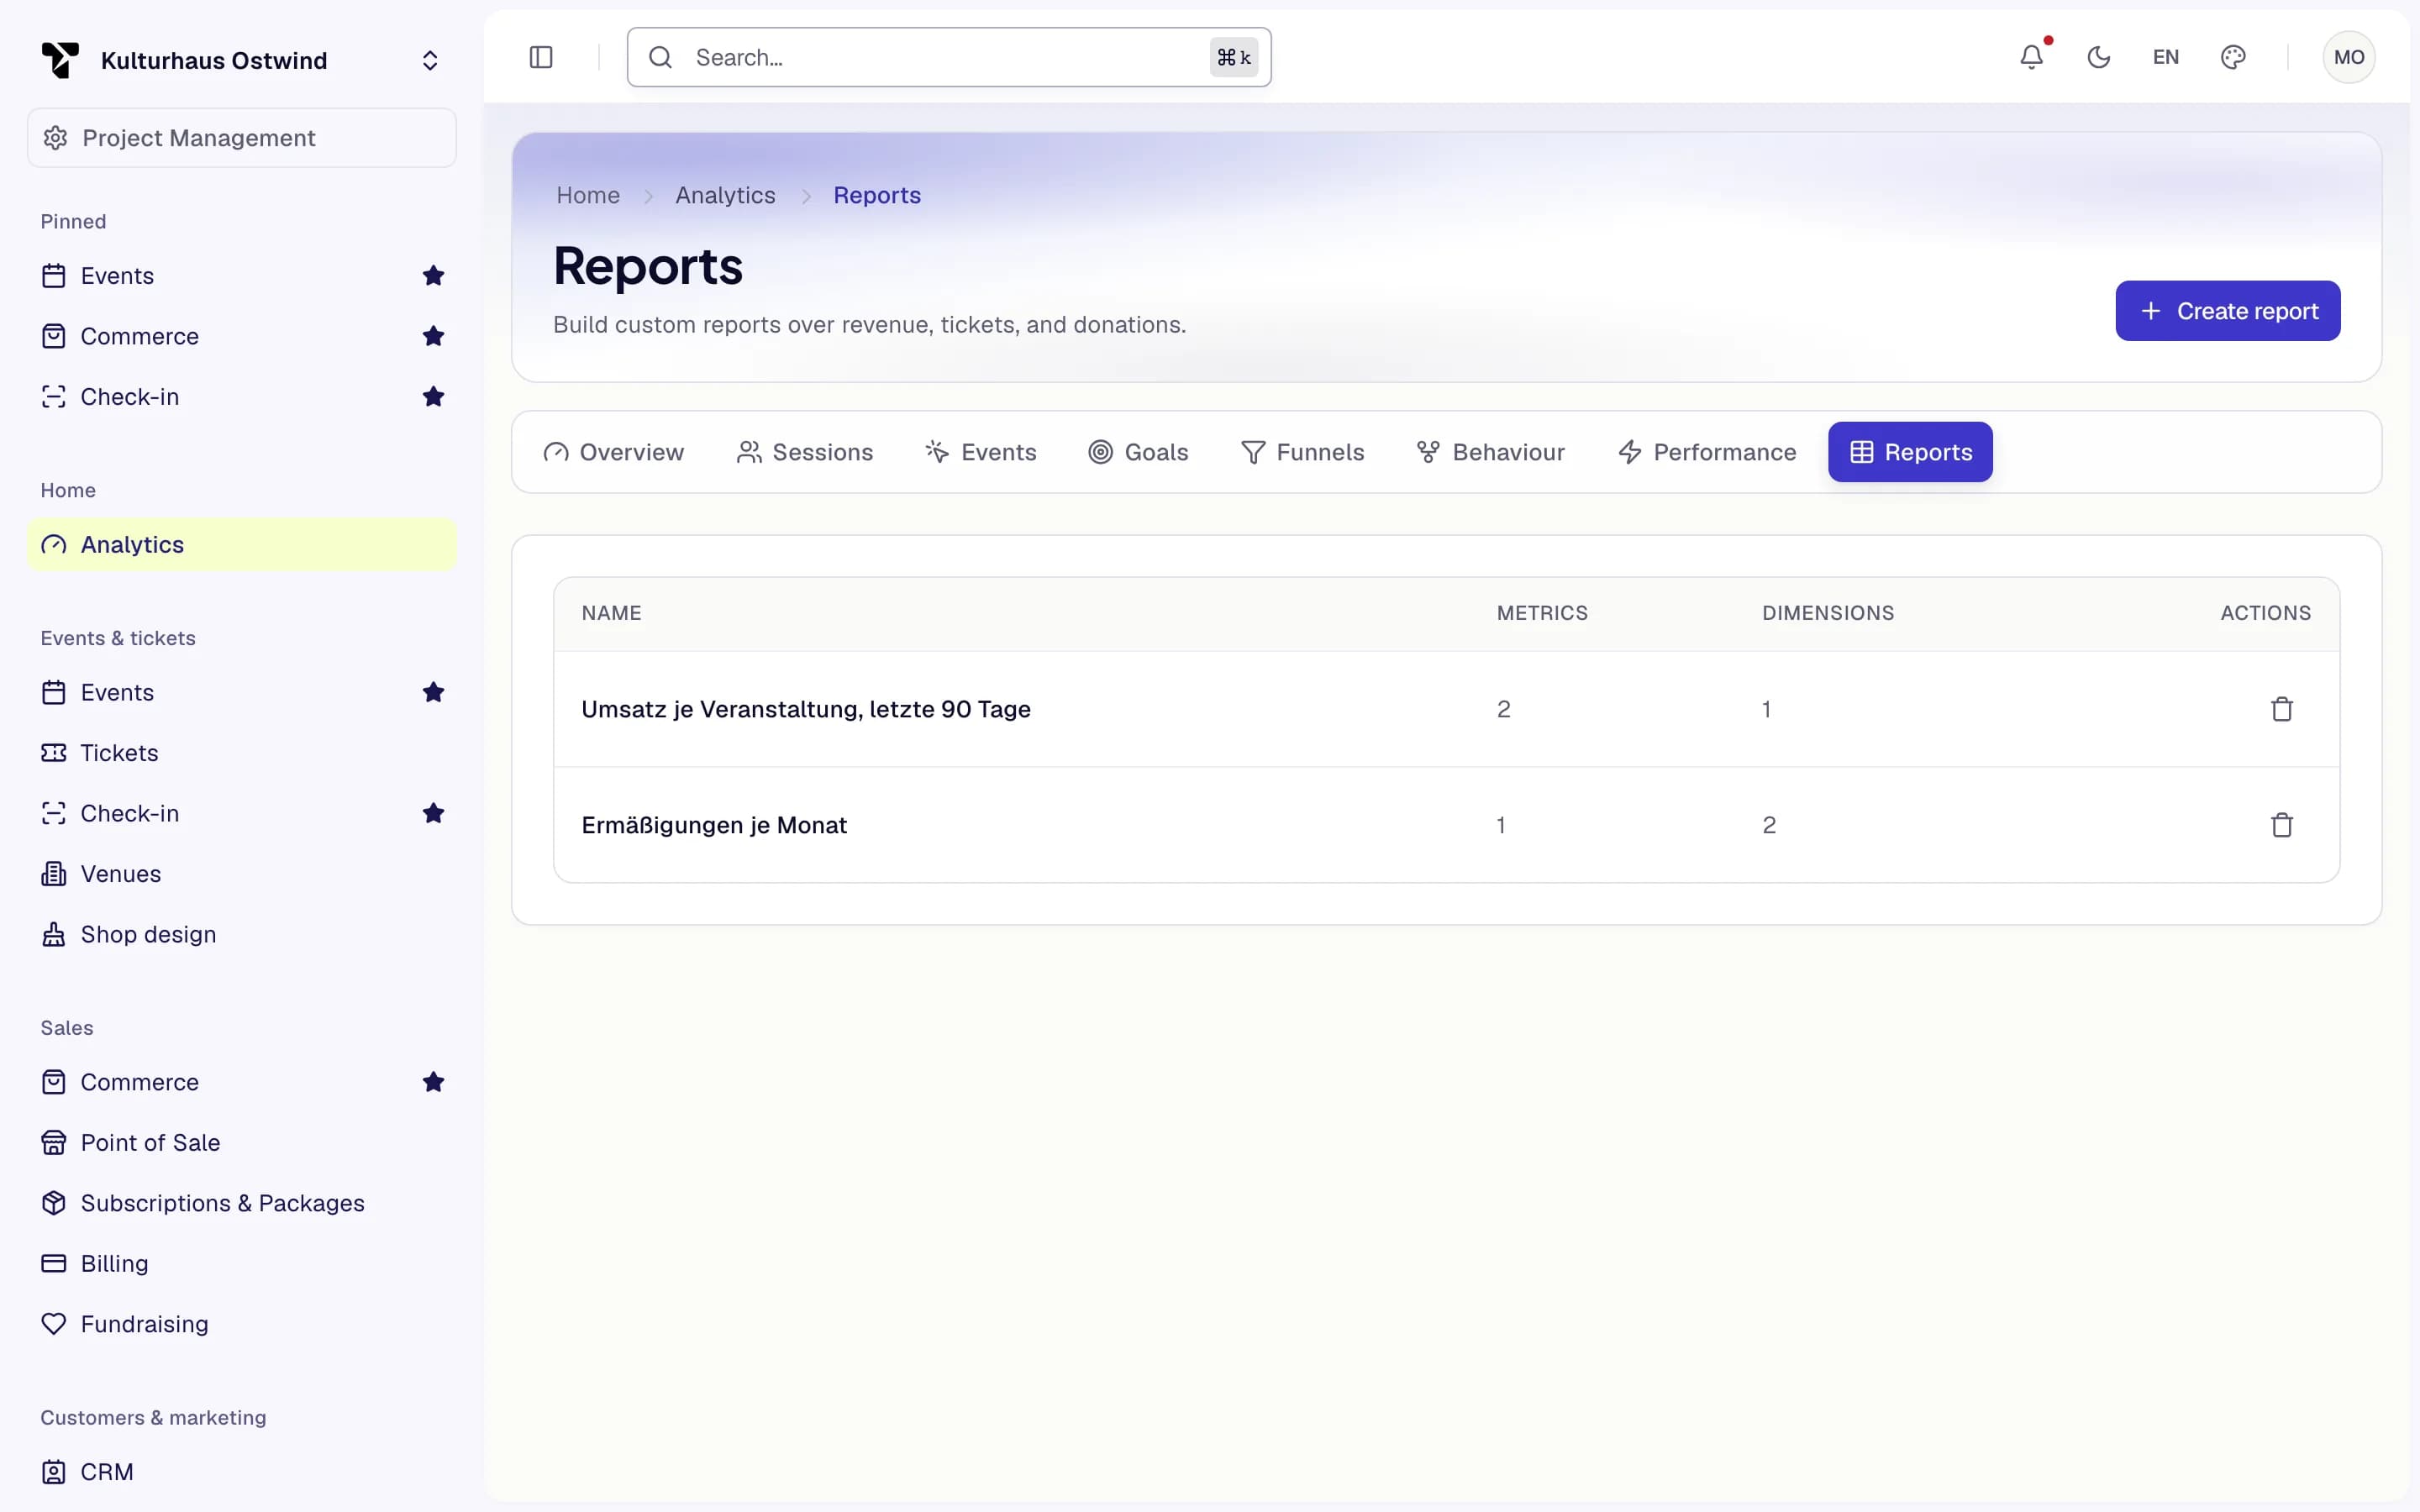
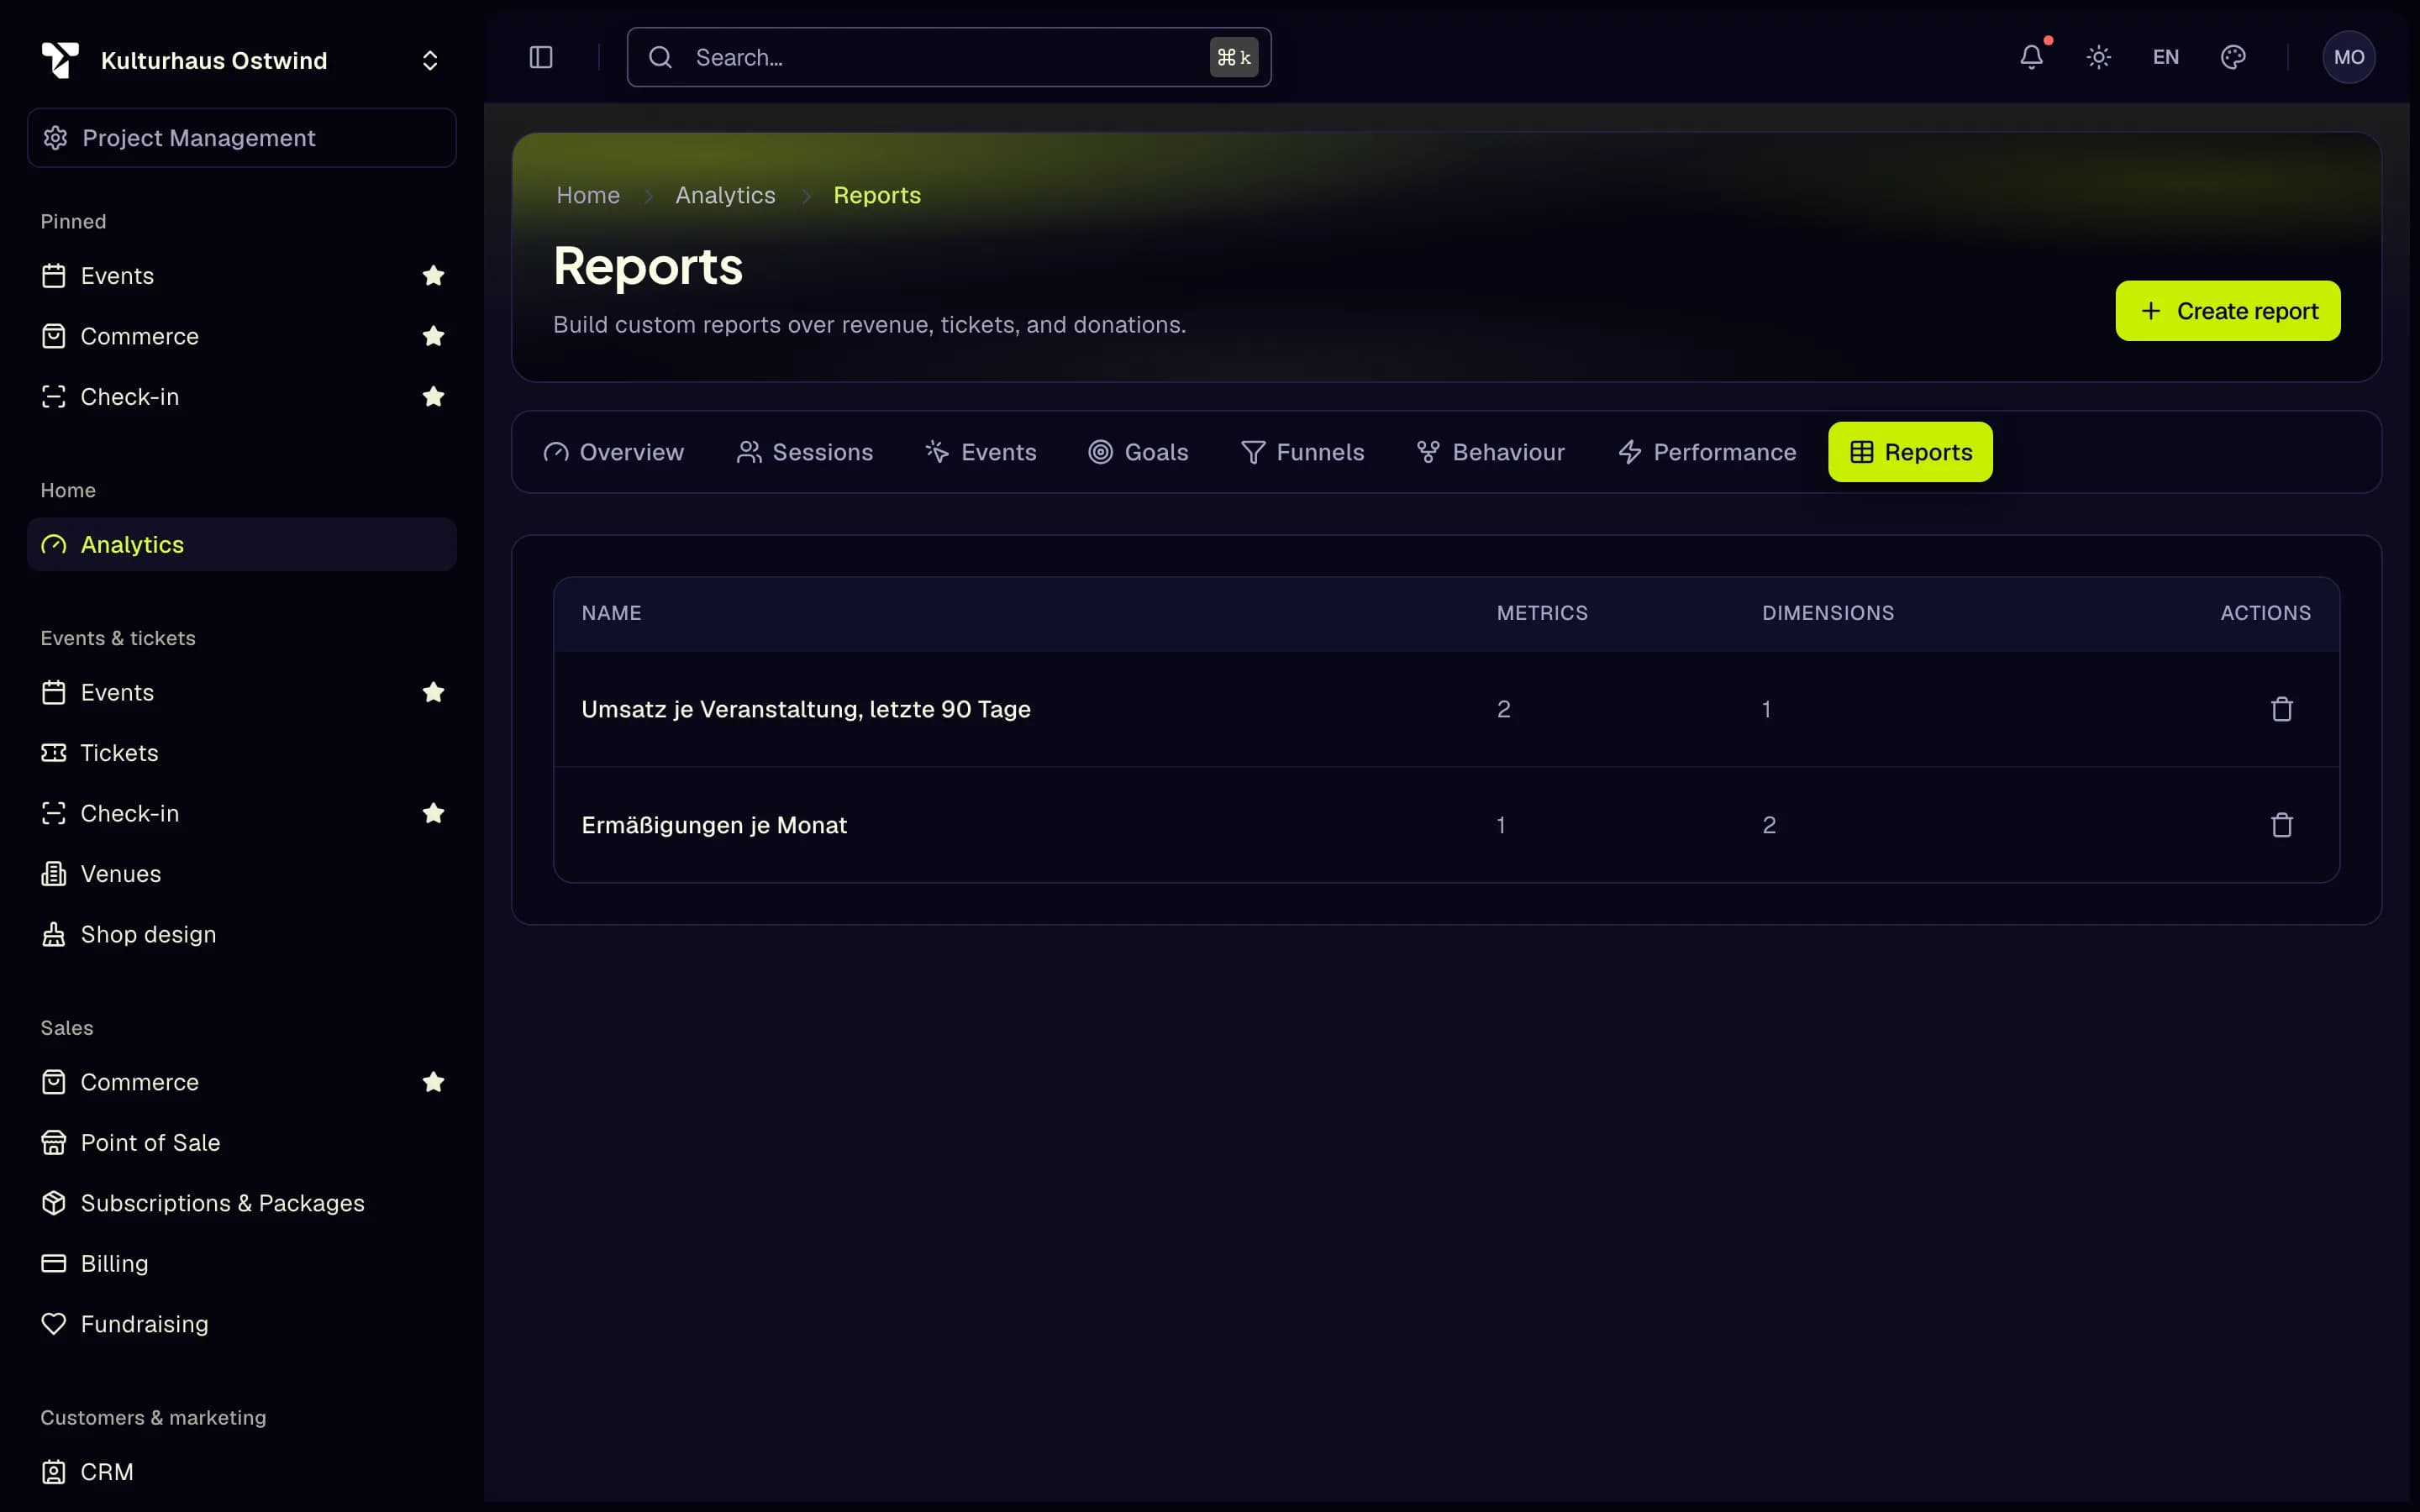
- Analytics
- Reports tab
- Create report
- Open a report
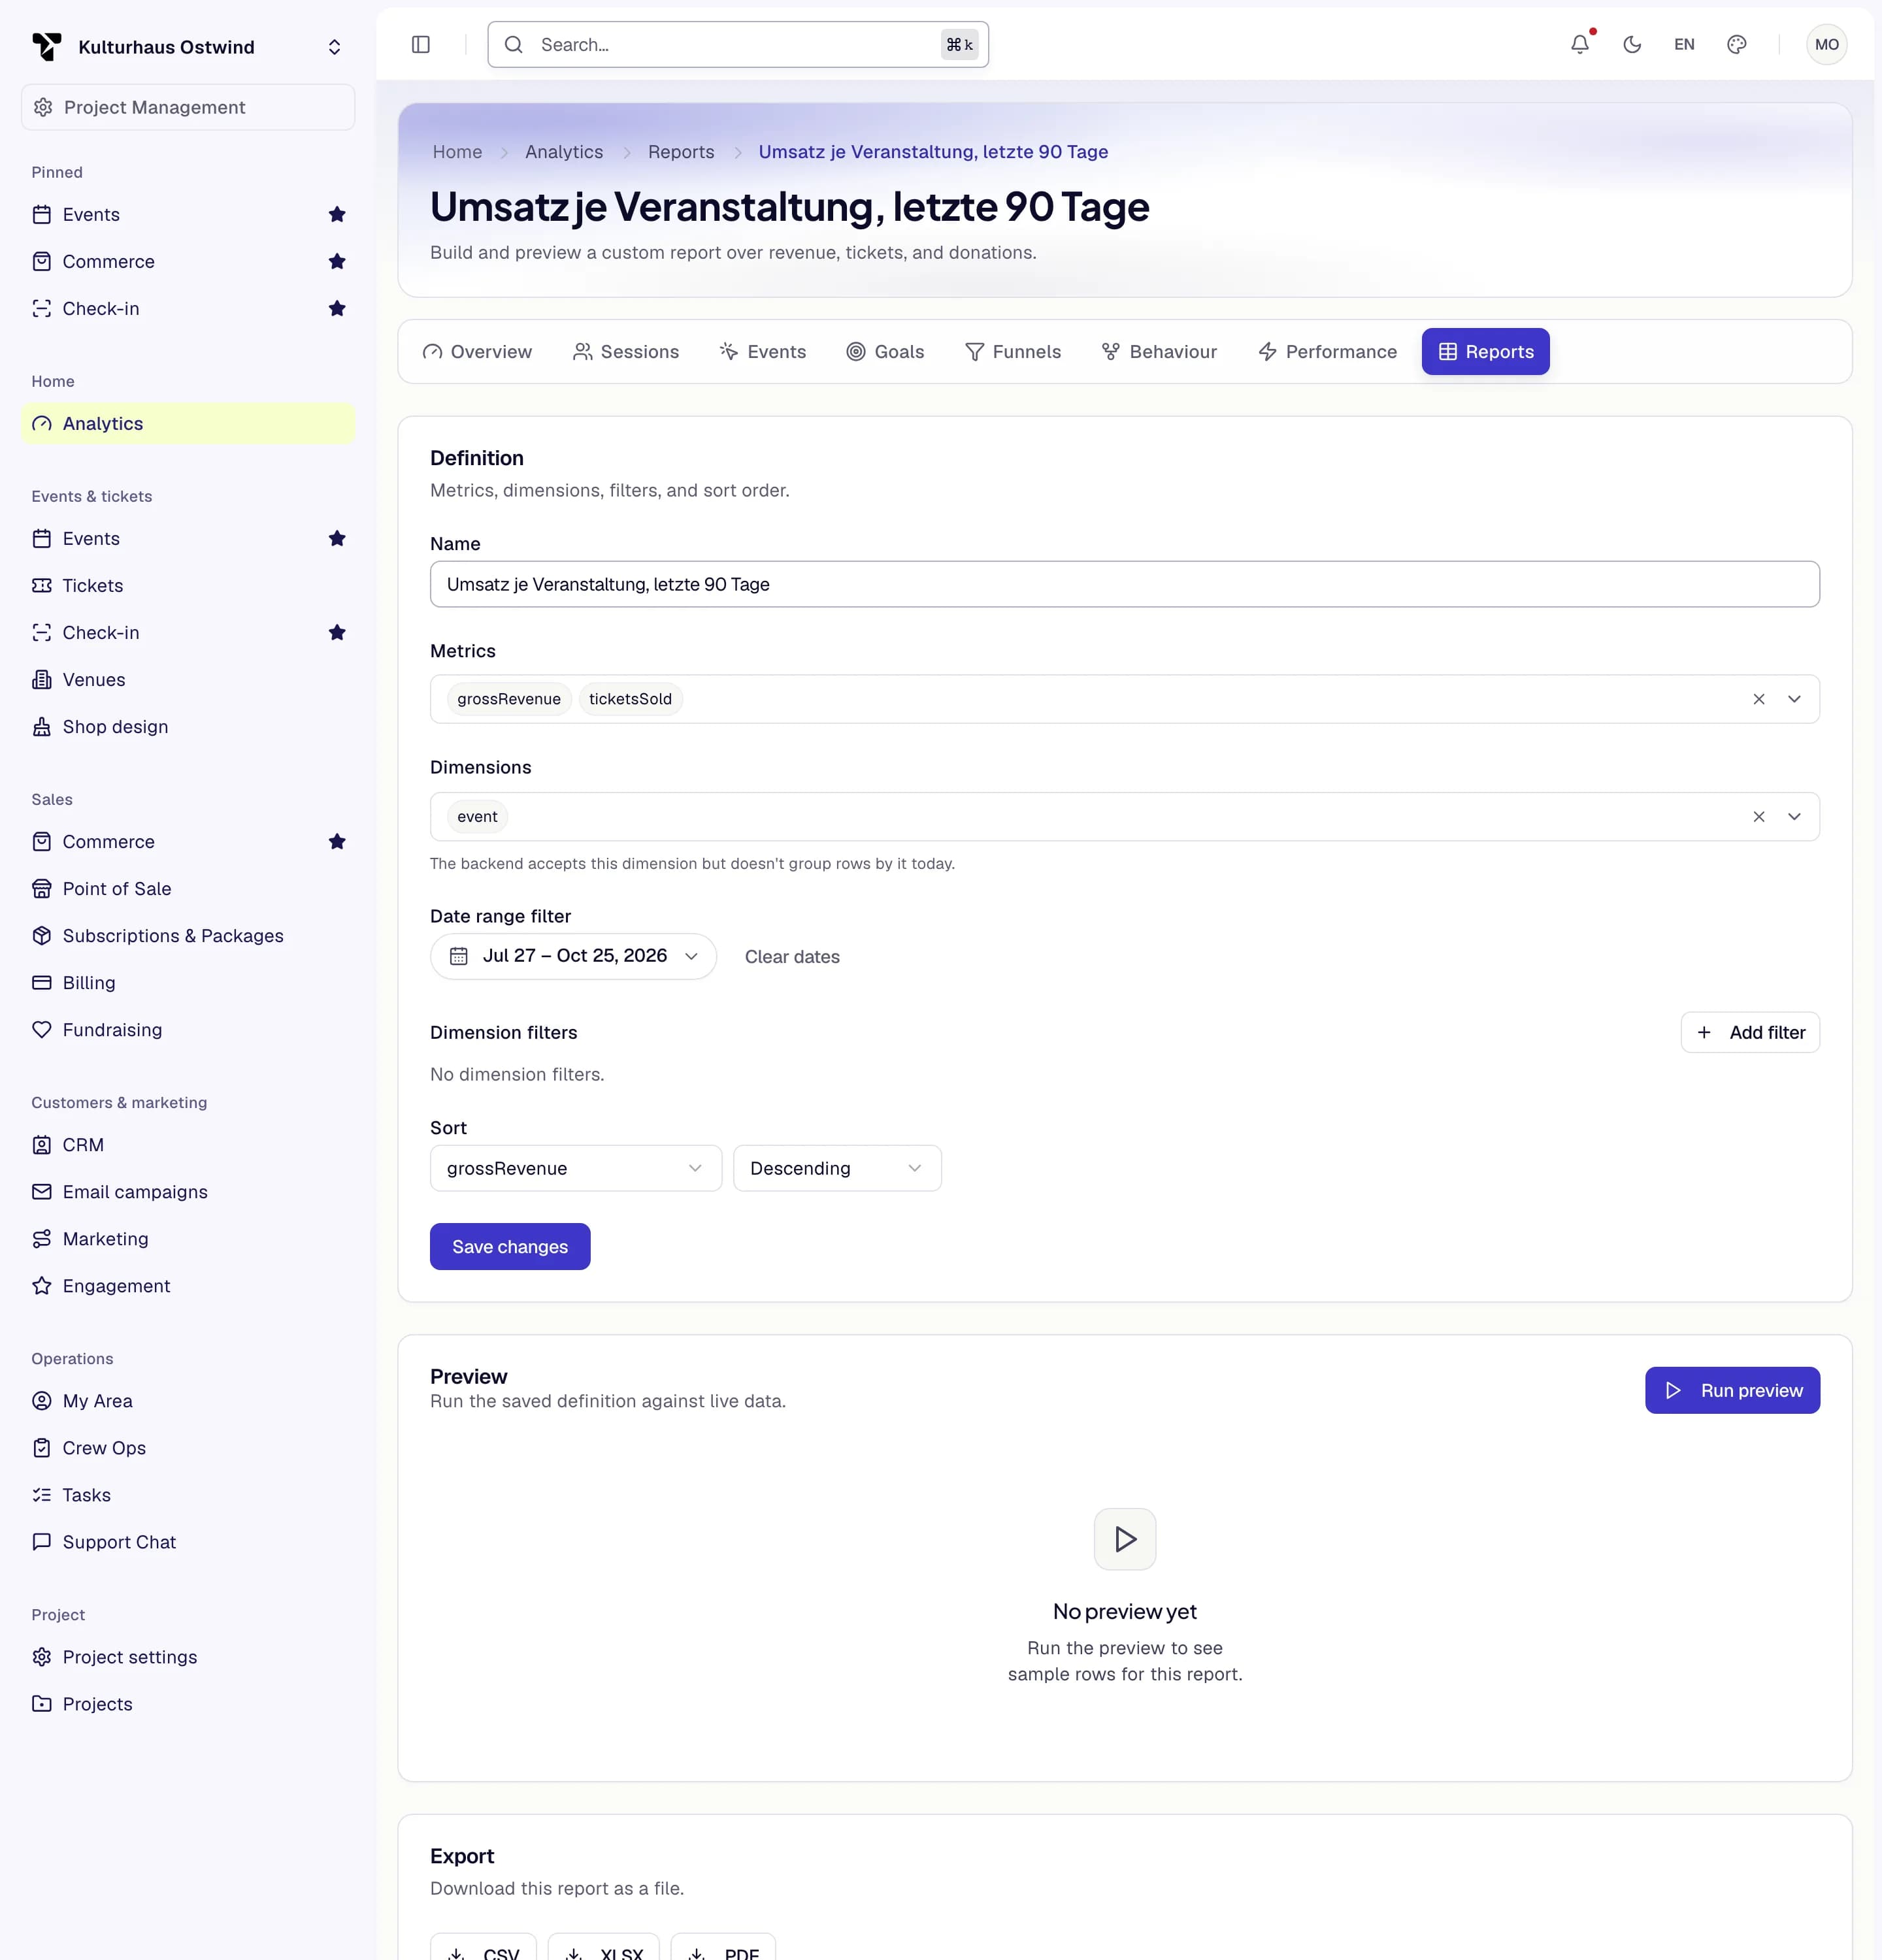
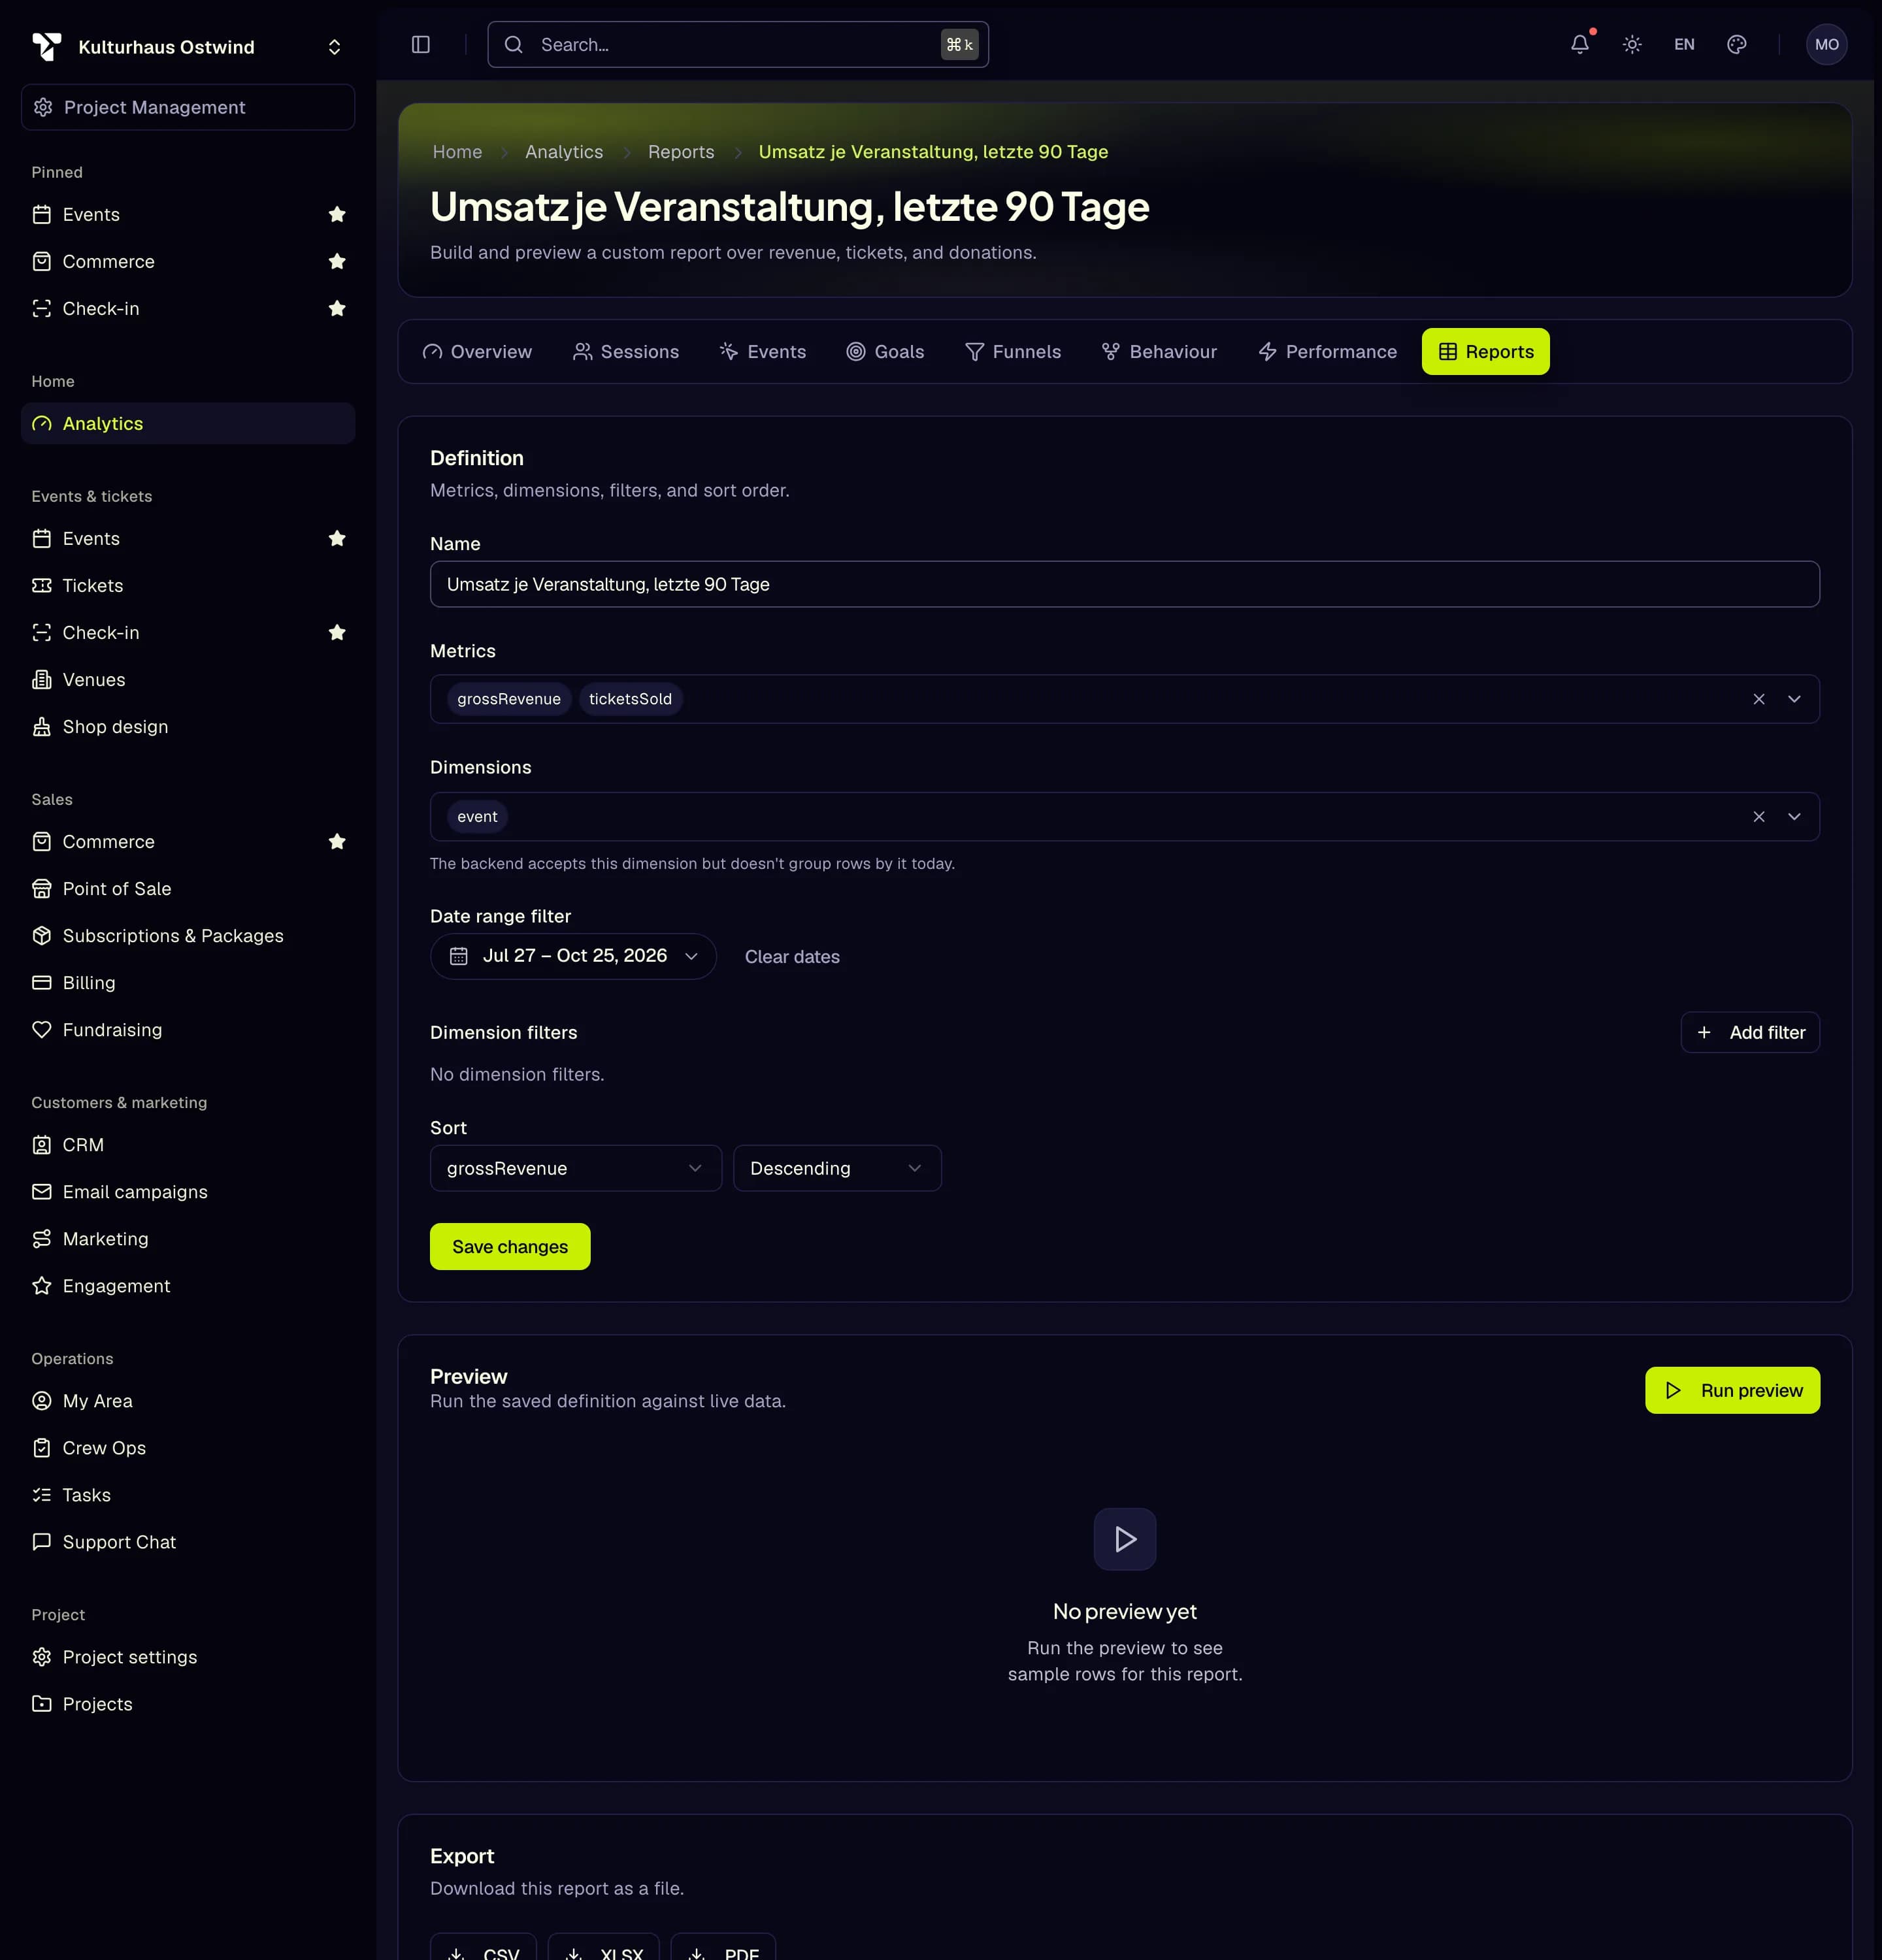
- Metrics
- Dimensions
- Date range filter
- Save changes
- Run preview
Common problems
- Every tab is empty. No visitor has allowed Statistics in the cookie banner in the period yet, or the shop address was set up only recently.
- The checkout funnel stays empty while sales come in. Steps are only counted for visitors who allowed Statistics.
- "A funnel needs between 2 and 10 steps" or "Each step needs type "page" with a path, or "event" with a
name" — a step is empty, a page step does not start with
/, or an event name contains a space.